How extreme weather affects your insurance premium
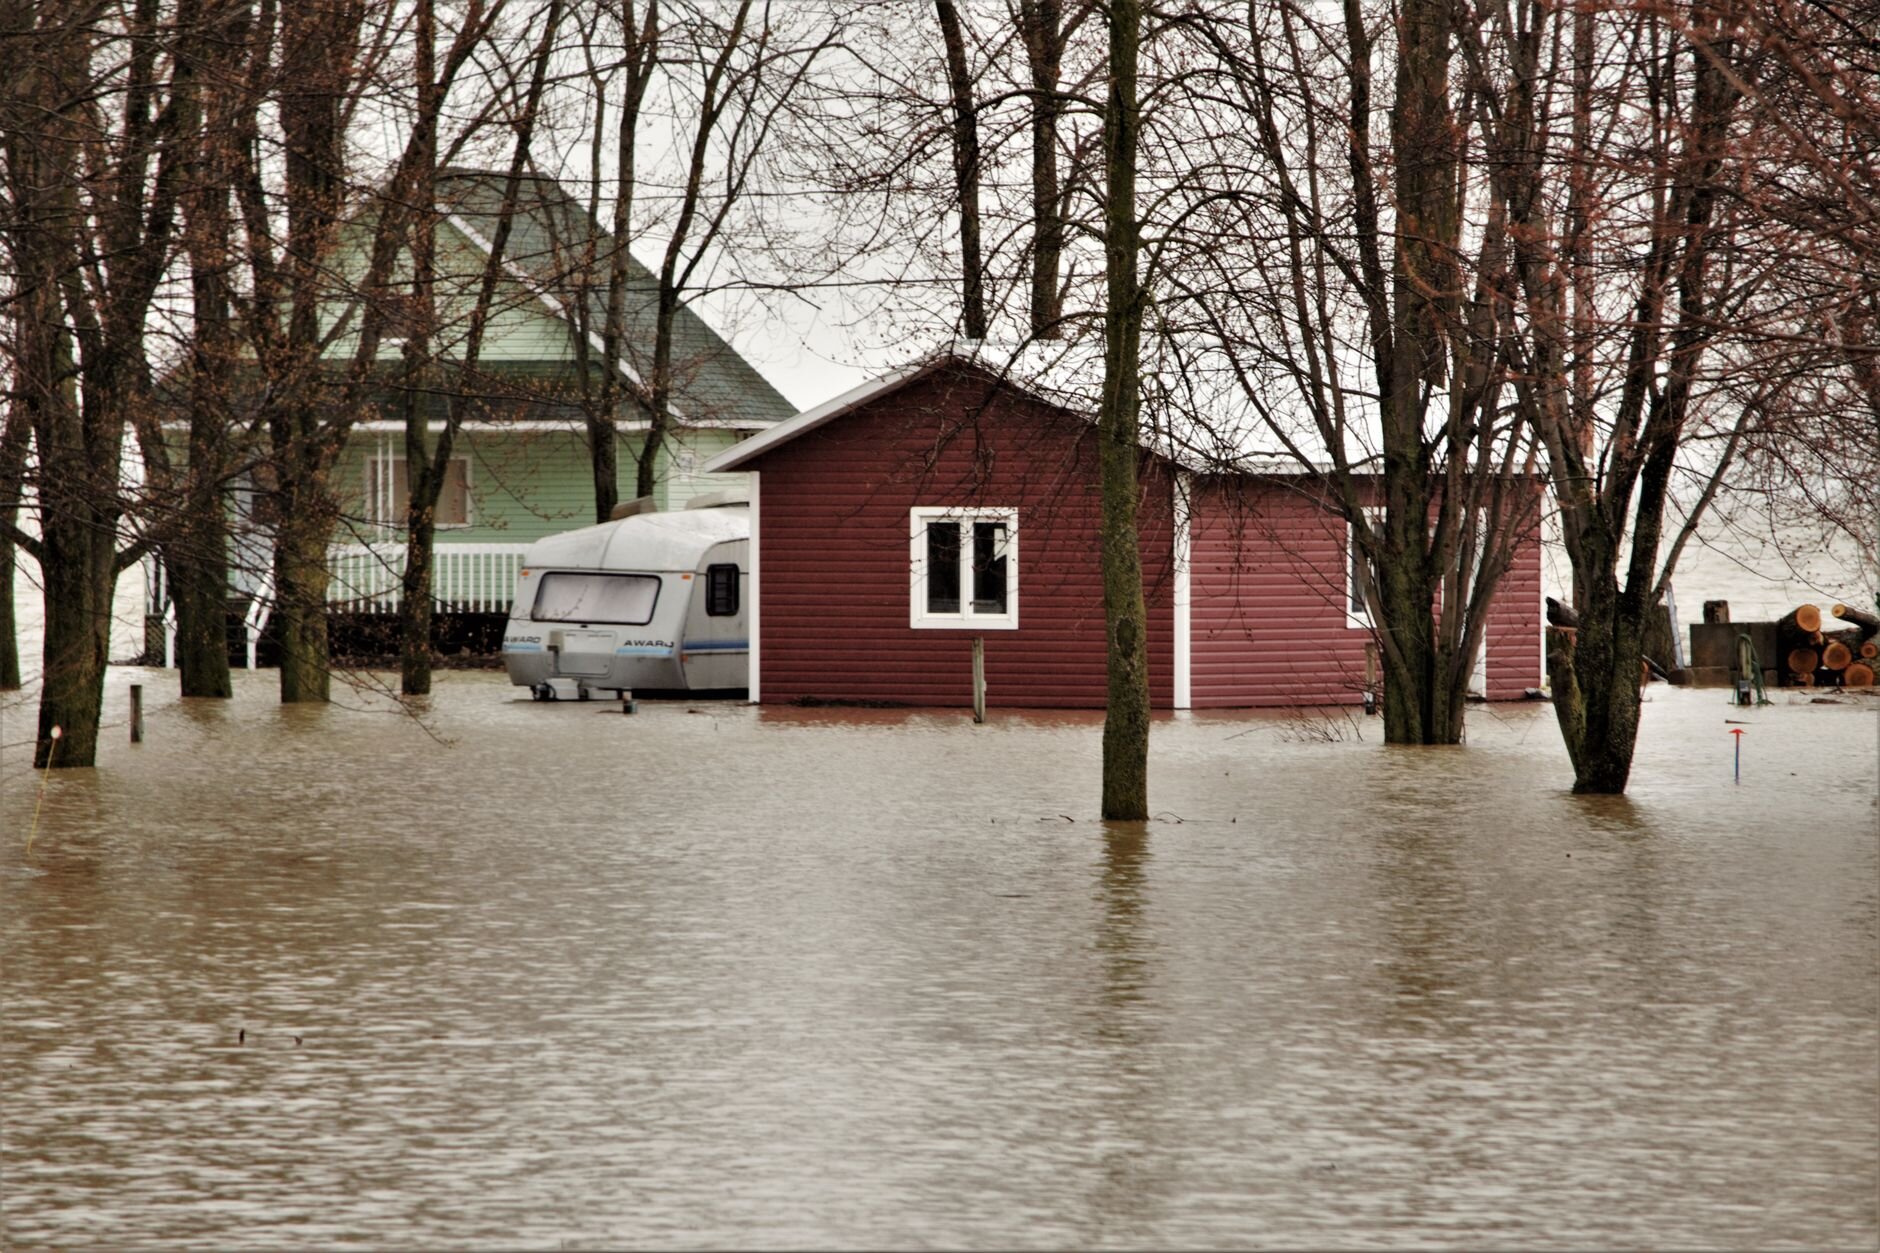
Two homes with the same rebuild cost can carry very different insurance premiums. The reason is usually beyond your front door. Wind, hail, flood, wildfire, and freezing temperatures all factor into how a carrier prices your policy. That's why your home’s geographic location often moves your premium more than the house itself.
Key takeaways
- Wind and hail damage are the largest single category of homeowner property-damage losses.
- Water damage and freezing rank among the most common homeowners claims, and together with wind and hail drive a large share of what carriers pay out.
- About 1 in 35 insured homes has a property damage claim related to wind or hail, according to the same Insurance Information Institute analysis.
- More than a quarter of U.S. homes face extreme hurricane, flood, or wildfire risk, per Realtor.com's 2025 Housing and Climate Risk Report, cited in Hippo's 2026 Housepower Report. Because that risk is concentrated regionally, rider adoption varies sharply by region too.
- Home maintenance projects like cleaning your gutters and updating your roof can make a big difference in lowering your risk of a weather-related loss.
Weather risk: the single biggest external factor
Carriers price a policy around the likelihood and cost of a future claim, and weather-related losses dominate that math. The Insurance Information Institute puts wind and hail at 41% of homeowner property-damage losses in 2022, with water damage and freezing responsible for another 28%. Combined, those two categories account for more than two-thirds of what insurers pay out. That's why your weather exposure shapes what your policy costs more than almost any other single factor.
Regional exposure: wind, hurricanes, wildfire, and freezing temperatures
Every region carries its own kind of environmental risk, and premiums reflect that:
- Tornado Alley and the central U.S.—high wind and hail frequency means premiums in these regions tend to run higher
- Gulf Coast and coastal states—hurricane and named-storm exposure adds both frequency and severity risk
- Wildfire regions—proximity to wildland areas and drought conditions raise premiums
- Cold-weather regions—freeze-related pipe bursts and ice-dam damage are a leading cause of water damage claims.
Your home can cost more to insure in a high-wind and hail state than an identical house in a low-risk state—even if they have the same dwelling coverage limit. Hippo's 2026 Housepower Report found that homeowner behavior tracks this exposure closely: 70% of Pacific region homeowners have purchased an insurance rider, the highest share of any region, compared with 53% in the Mountain region, the lowest.
How location risk shows up in your premium
Underwriters price around your home's specific exposure, not just the state it sits in. They weigh distance to coast, elevation, wildfire interface zones, and local building codes. That's why it's worth comparing quotes by ZIP code rather than by state, and reviewing regional weather risk as part of any home purchase decision.
Consider two similarly valued homes a few miles apart in a western wildfire interface zone: one borders undeveloped brush, the other sits in a cleared subdivision. The difference in each home’s relative wildfire risk can be so great that it drives a huge variance in their premiums. And in some cases, it might be so great that a carrier declines to offer a policy at all.
The difference between each home’s risk profile is its defensible space: the cleared distance between the house and anything that can burn. The closer the brush sits, the higher the risk a carrier prices in. The same math shows up along hurricane-exposed coastlines, where a few miles inland can be the difference between a standard policy and one that requires a separate wind or flood rider, an add-on that covers a risk the base policy leaves out.
How to proactively improve your home’s risk profile
You can offset regional risks and improve how a carrier prices your policy through some key home features and maintenance issues:
- Roof age and material—impact-resistant roofing is one of the more commonly recognized mitigation factors in wind- and hail-prone regions
- Elevation and drainage—homes with better site drainage and elevation relative to flood zones typically carry lower flood-specific risk
- Modernized systems—updated electrical, plumbing, and heating systems reduce non-weather claim risk that can otherwise compound with weather exposure
- Defensible space and materials—in wildfire-prone areas, clearing vegetation and using fire-resistant materials are common mitigation steps underwriters look for
- Seasonal prep—preparing for hail season and other seasonal risks ahead of time can reduce both the odds and the severity of a claim
- Riders—add-on options for regional risks like flood or water backup can help address gaps a standard policy may leave open
The homes that come through a bad season with the least damage are rarely the ones with the most expensive finishes. They're the ones where the basics were handled before the storm arrived: roofing, drainage, and defensible space.
The bottom line
Environmental risks aren’t evenly distributed, and nor are the costs to insure against them. Rebuild cost sets the baseline, but weather risks like wind, hail, water, freezing temperatures, and wildfire exposure often separate a below-average premium from an above-average one. Understanding your home's specific, regional risks and taking steps to mitigate them is how you can lower your premium.
Hippo compares quotes from 70+ trusted carriers in about 60 seconds. Get your free quote today.
This report presents findings from a survey administered by Centiment on behalf of Hippo on September 22, 2025. Respondents were 1,619 U.S. homeowners age 18 and older; results are census-balanced with a margin of error of approximately ±2% at a 95% confidence level. The margin of error and confidence level for data filtered by specific demographics (subgroups) may differ from the overall result. Because these subgroups are naturally smaller than the total sample, they may have a larger margin of error than the ±2% for the full data set.
These insights reflect observed trends within the surveyed population and are provided for informational purposes only. Certain additional information included in this article was compiled from sources not affiliated with Hippo. While we believe this information to be reliable, we do not guarantee its accuracy or completeness. For any insurance-related decision, please consult your licensed insurance producer. Sources cited are publicly available and referenced in September 2026.