Hippo Resilience Report: Best States for Climate Change

Two people stand on the roof of a home, installing solar panels on a sunny day.

The climate is shifting, and homeowners are feeling the impact. According to our 2024 Housepower Report, 28% of homeowners ranked extreme weather preparedness as a top concern—up from 25% in 2023. This year-over-year increase reflects growing anxiety around climate-related risks, and homeowners have good reason to be wary.

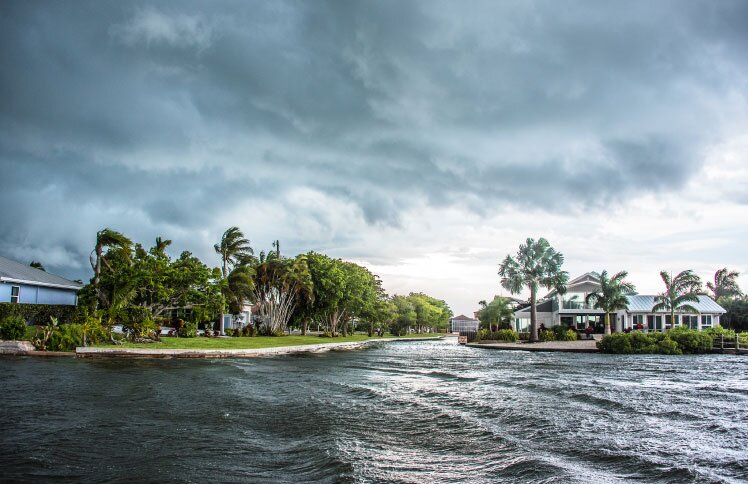
In 2024, nearly half of U.S. homes (45%) faced at least one type of severe climate risk. Not only do these events pose a real threat to homeowners, but they also drive up insurance costs and put pressure on home values and maintenance budgets. 

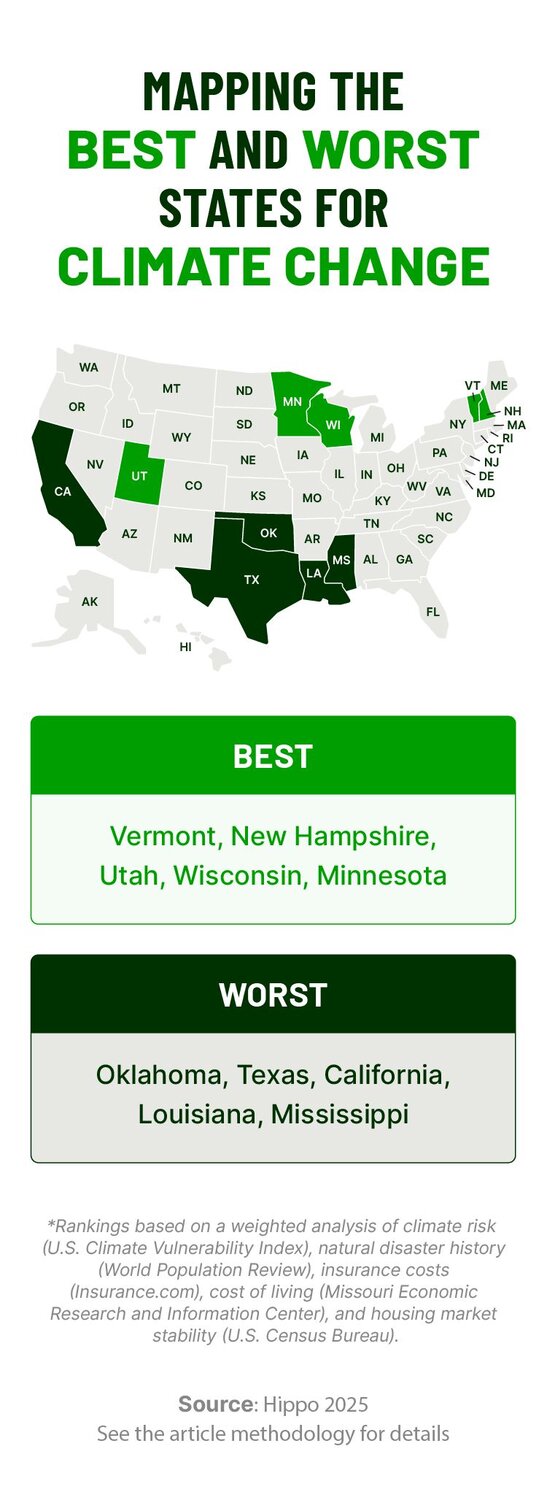
Given these increasing risks, some homeowners are considering relocation. To help with this decision, we identified the best and worst states for climate change, where homeowners generally experience more or less exposure to climate-related threats like hurricanes, wildfires, and more.

See our full methodology below for source links and a detailed breakdown of how we evaluated insurance costs, disaster risk scores, and other key factors.

The rising costs of climate risk for homeowners

Climate events are pushing costs higher for many homeowners. More frequent wildfires, floods, and storms can lead to higher insurance premiums, reduced coverage availability, and rising out-of-pocket expenses for maintenance and repairs. 
"In 2024, when faced with unexpected repairs, many homeowners shelled out high out-of-pocket costs to manage their homes. We understand the importance of preventative care and are here to help homeowners confidently protect their homes, and in turn, their primary financial investment." — Rick McCathron, President and CEO of Hippo
Recent studies indicate this could have a lasting effect on homeowners and buyers, with human-driven climate change causing an estimated $1.47 trillion in net property value losses. 

The financial burden may only grow for younger generations. Climate change could cost a child born in 2024 between $500,000 and $1 million over their lifetime due to increased living expenses and reduced earnings. 

Fortunately, the cities listed below carry less climate risk than others, potentially offering more predictability and long-term peace of mind for homeowners.

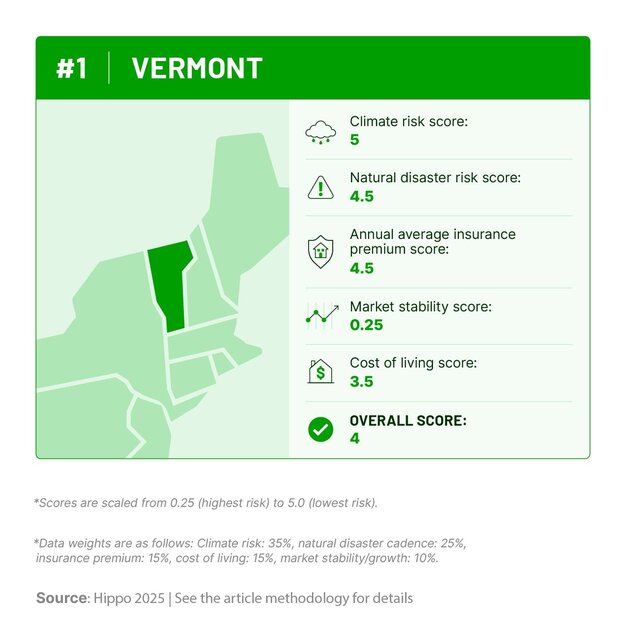
The top 5 best states to live in for climate change 

We identified five of the most climate-resilient states using a custom methodology. While climate and natural disaster risk drove our analysis, they weren’t the only factors. 

We also weighed insurance costs, cost of living, and housing market trends to ensure our top picks reflected climate resilience and everyday practicality.
Illustration of a U.S. map, highlighting the best and worst cities for climate change.

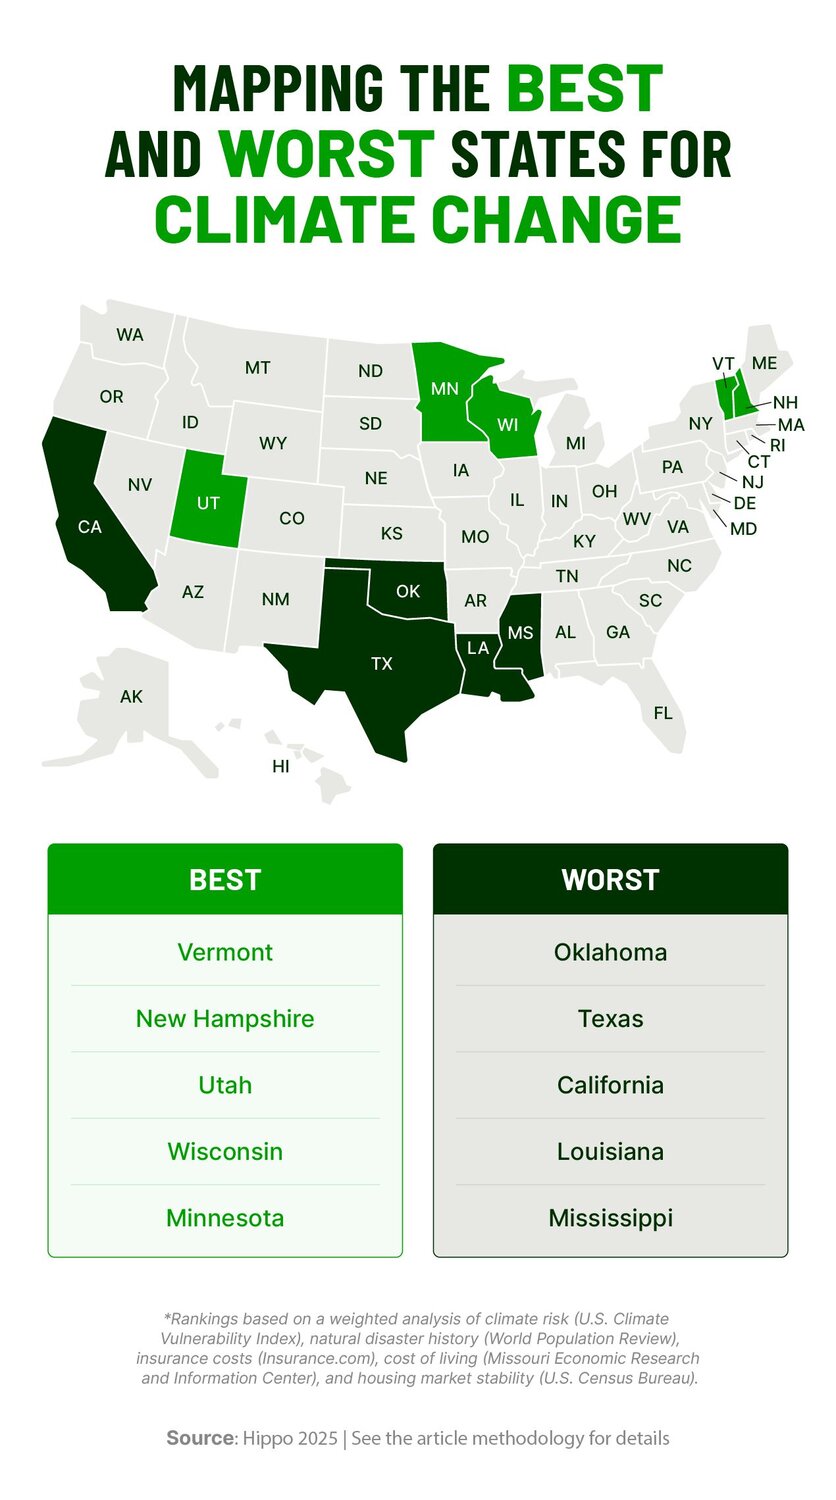
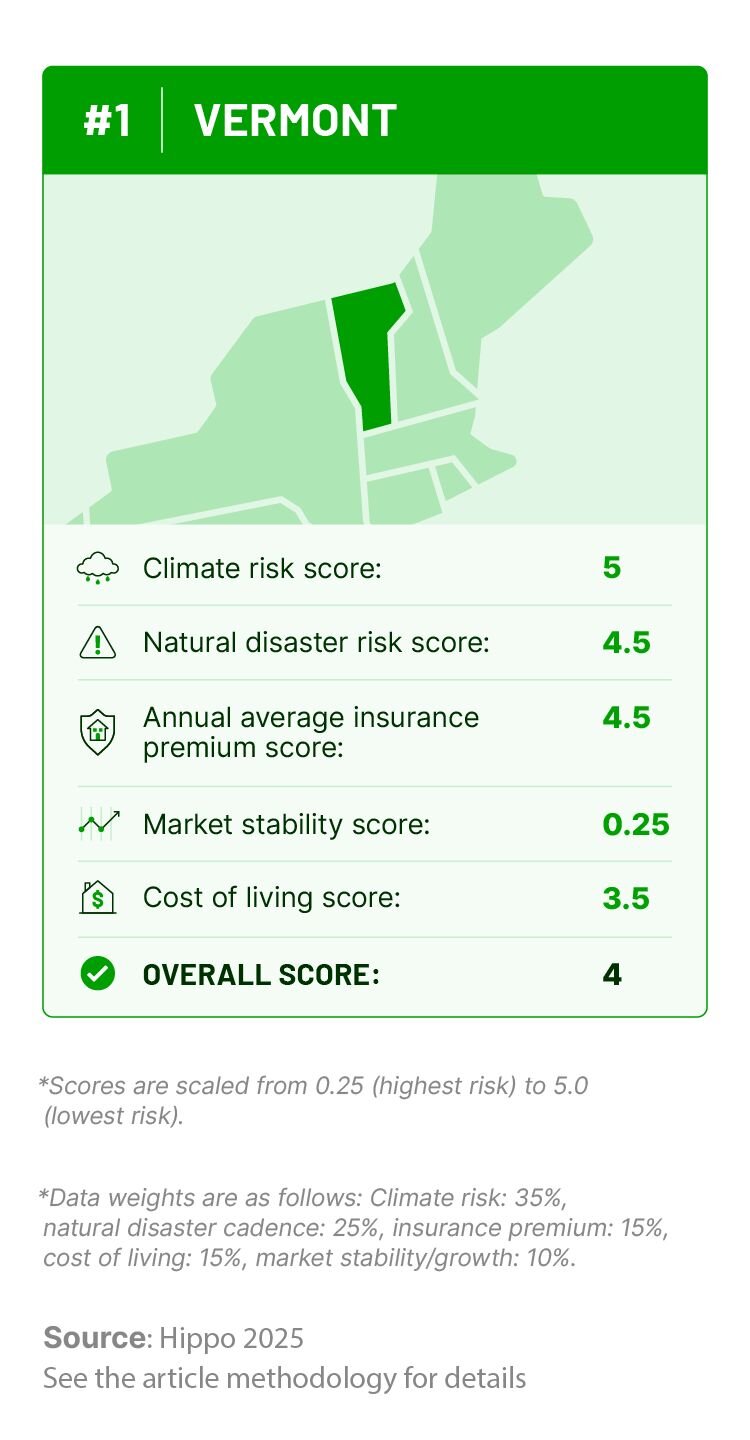
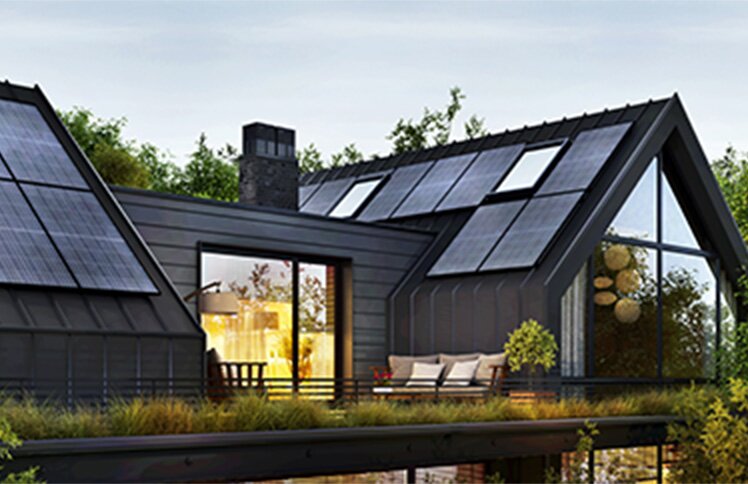
1. Vermont: Leading the way on renewable energy and net-zero homes

Vermont is the best state for climate change thanks to its climate profile that, for the most part, avoids extremes. Since 19531, it has only experienced 45 federally declared natural disasters and, according to our analysis, is rated the least vulnerable state for climate risk. 

While no place is immune to extreme weather events (Vermont faced historic flooding in July 2023), its response underscores the state’s long-term focus on resilience. Vermont climate change policies emphasize flood-resistant building codes, and communities across the state are investing in renewable energy infrastructure and land conservation.

For example, Burlington, VT, was one of the first U.S. cities to run entirely on renewable electricity, while Montpelier’s Net Zero Energy initiative continues to make energy-efficient home upgrades more accessible.

These proactive measures go hand in hand with lower homeowner insurance costs, which average $1,263 in Vermont annually3. All this makes it an appealing option for those looking to plant roots in a calmer climate.
Graphic outlining Vermont’s climate risk, natural disaster history, insurance costs, cost of living, and housing market stability scores.

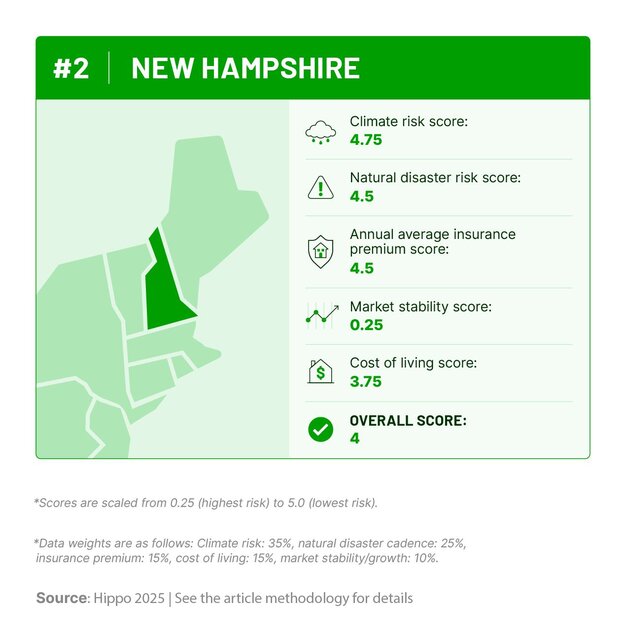
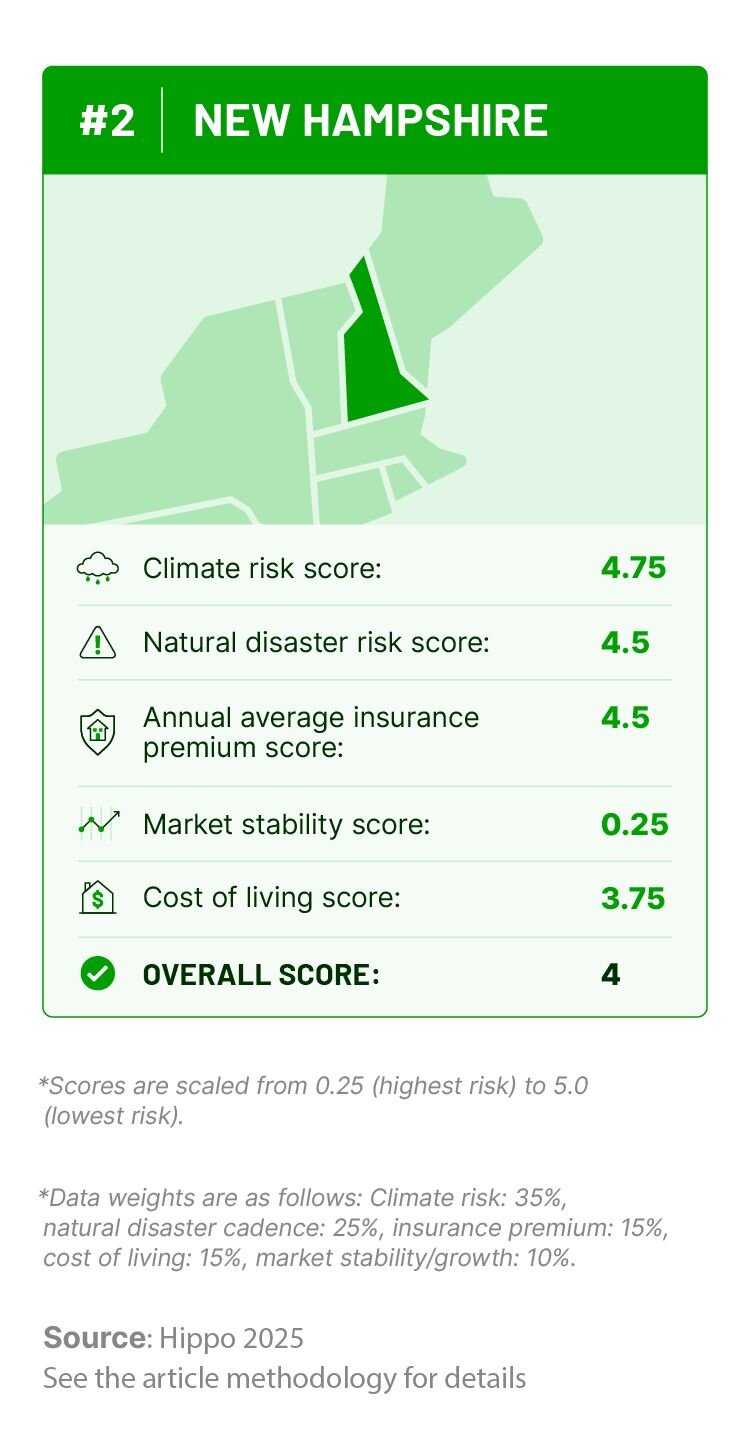
2. New Hampshire: Forest cover and forward-thinking coastal planning

New Hampshire offers an ideal balance of scenic living, four true seasons, and lower climate exposure than much of the U.S. The Granite State sees fewer severe weather events, particularly wildfires, flooding, and heat-related emergencies, making it a naturally more climate-resilient option for homeowners.

Building on this advantage, New Hampshire climate change policies, like the Priority Climate Action Plan, outline efforts to further protect communities by reducing pollutant emissions, boosting economic growth, and improving quality of life. The plan targets key sectors like transportation and residential buildings to strengthen long-term climate resilience across the state.

The state is also one of the most forested in the country, with 82% of land covered in woods, which offers natural protection against extreme heat and provides excellent recreational opportunities for residents. 

Cities like Concord benefit from this greenery, while coastal climate-resilient cities like Portsmouth invest in infrastructure to help prepare for potential sea-level rise.

That said, the cost of living is slightly above the national average. This is partially offset by lower insurance costs, with New Hampshire boasting an average annual home insurance premium of $1,2213
Graphic outlining New Hampshire’s climate risk, natural disaster history, insurance costs, cost of living, and housing market stability scores.

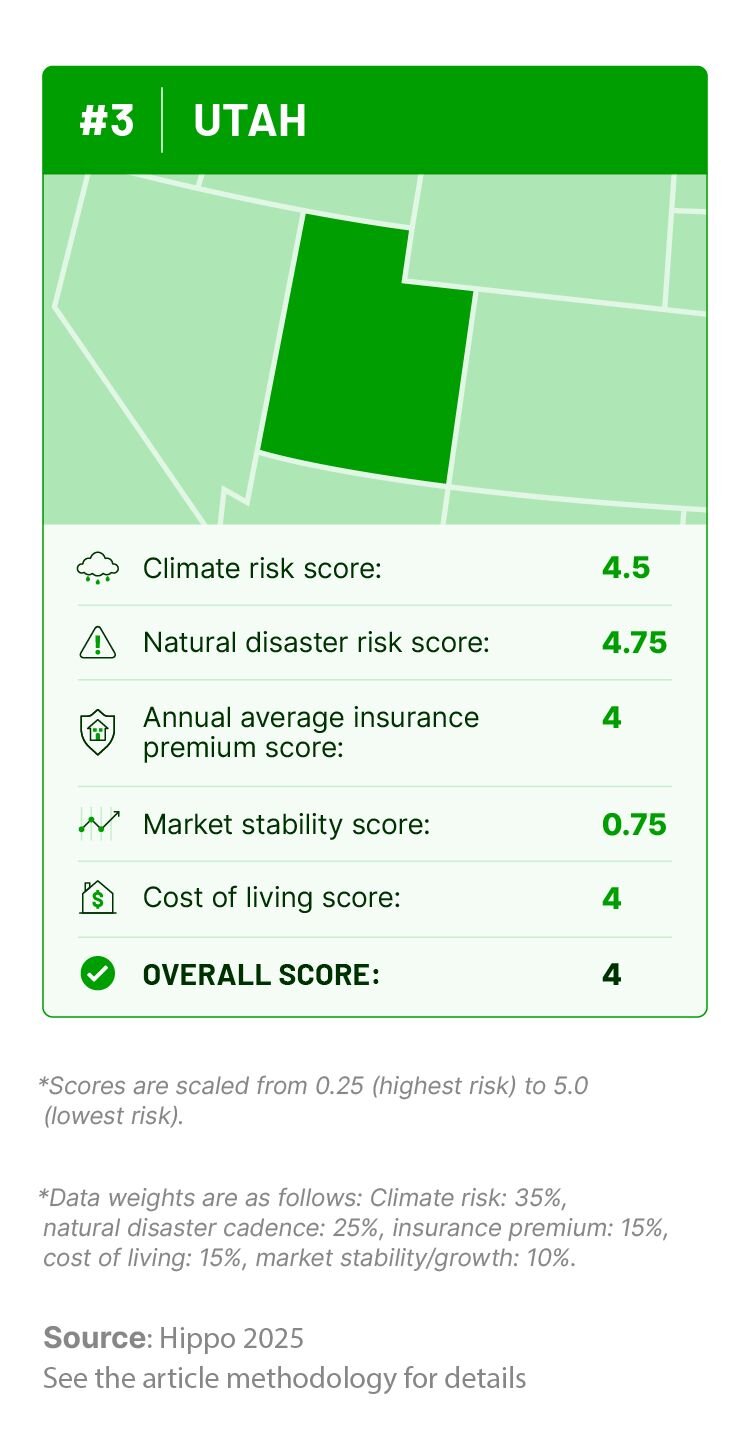
3. Utah: Climate buffers in the high desert

Utah’s dry climate and elevated terrain help shield homeowners from hurricanes, major floods, and storm surges—but it’s not without its challenges. Drought and wildfires remain a concern, especially in rural and suburban areas. Still, Utah consistently ranks better than many western states when it comes to natural disaster losses.

Utah’s average cost of living also sits slightly above the national average, depending on the location. For example, the average home price in Salt Lake City (the state’s largest metropolitan area) sits at around $575,584. By contrast, Park City’s average home sale price often exceeds $1.5 million, driven by its luxury amenities and proximity to ski resorts.

This range highlights Utah's diverse economic landscape, even amidst its rapid growth, reflected in the 23,902 new residential construction permits issued in 20244. Utah could be an excellent choice if you’re looking for beautiful outdoor recreation like hiking, climbing, or BASE jumping.
Graphic outlining Utah’s climate risk, natural disaster history, insurance costs, cost of living, and housing market stability scores.]

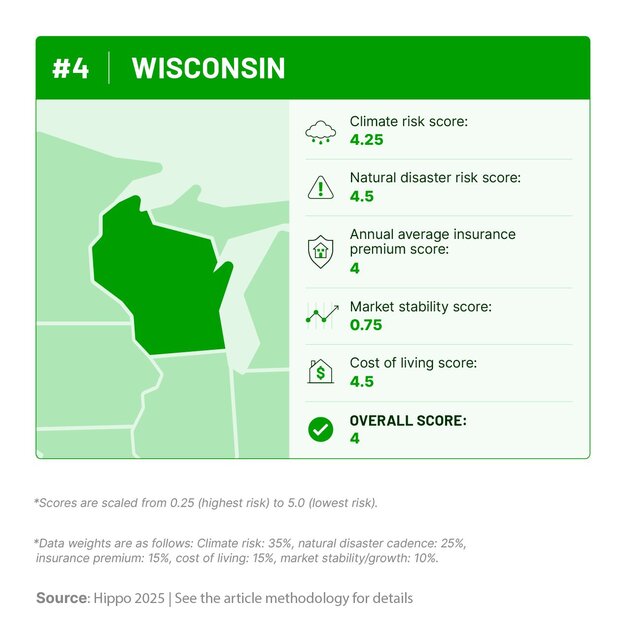
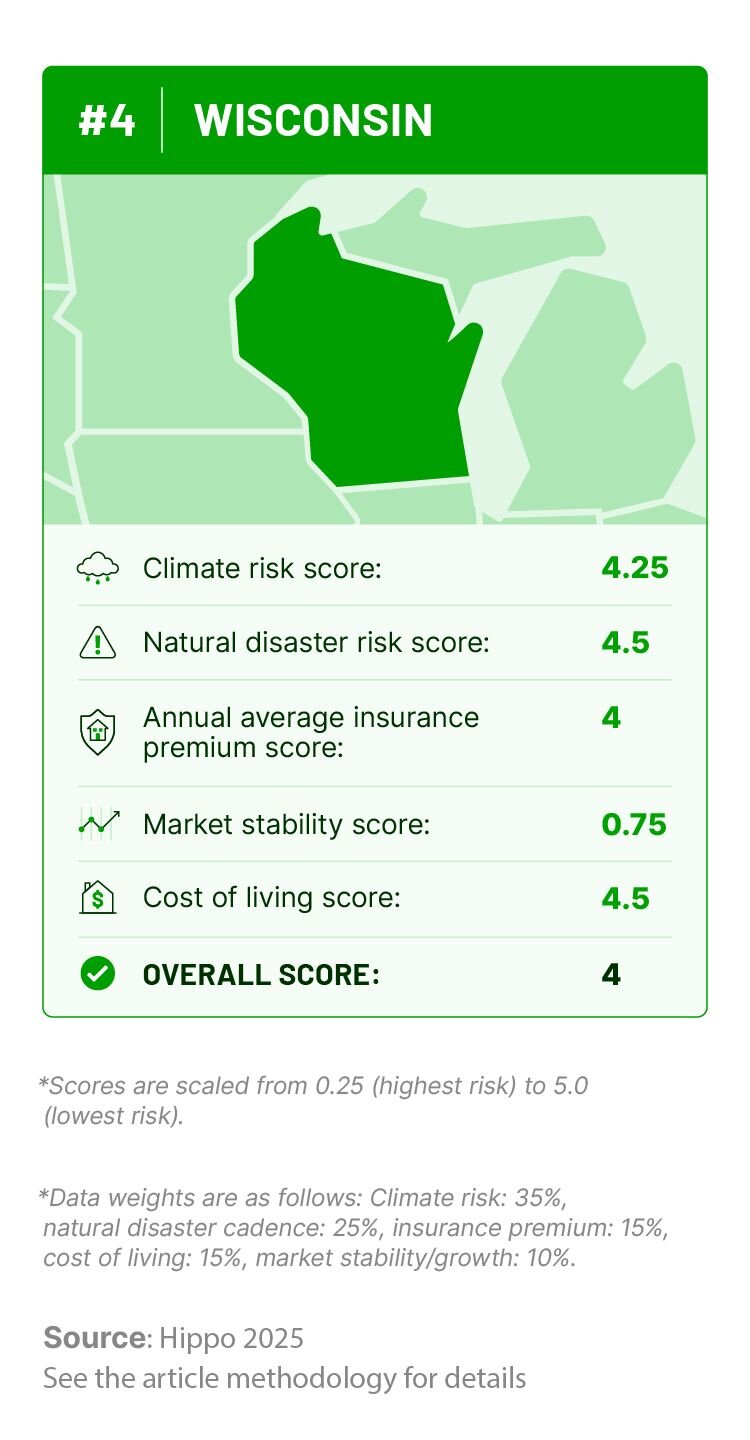
4. Wisconsin: Urban flood resilience meets affordable insurance costs 

Wisconsin’s inland location protects it from many extreme climate events plaguing other states. Wildfires are rare, hurricanes don’t reach this far north, and even flooding tends to be well-managed with existing infrastructure. It’s a state where climate-related surprises are fewer, and communities know how to handle what does come their way.

The state’s climate resilience isn't accidental. Communities across Wisconsin have steadily invested in stormwater system upgrades, levee reinforcement, and emergency preparedness. Milwaukee is a great example of how communities stand behind Wisconsin's climate change policies by pursuing green infrastructure strategies to help curb urban flood risk. Meanwhile, Wisconsin’s participation in FEMA’s Community Rating System has helped lower flood insurance costs for homeowners in designated areas.

Affordability is also a strong point. Our analysis found that the cost of living is below the national average, and Wisconsin homeowners typically enjoy moderate insurance premiums, averaging $1,662 per year3.
Graphic outlining Wisconsin’s climate risk, natural disaster history, insurance costs, cost of living, and housing market stability scores.

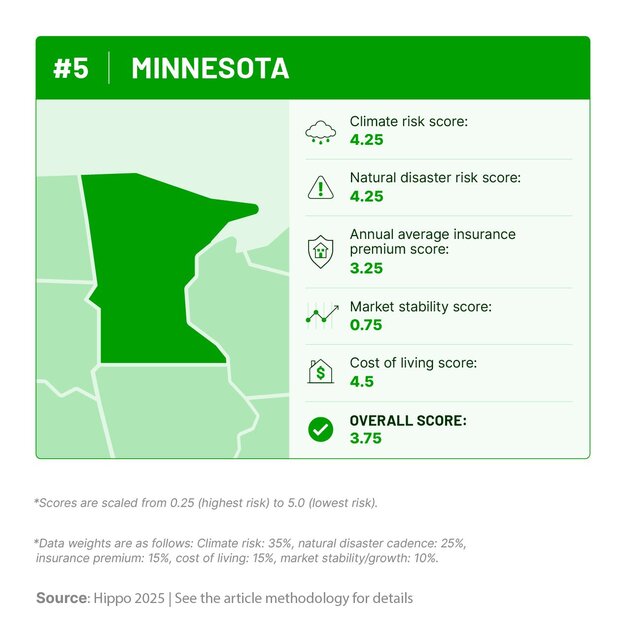
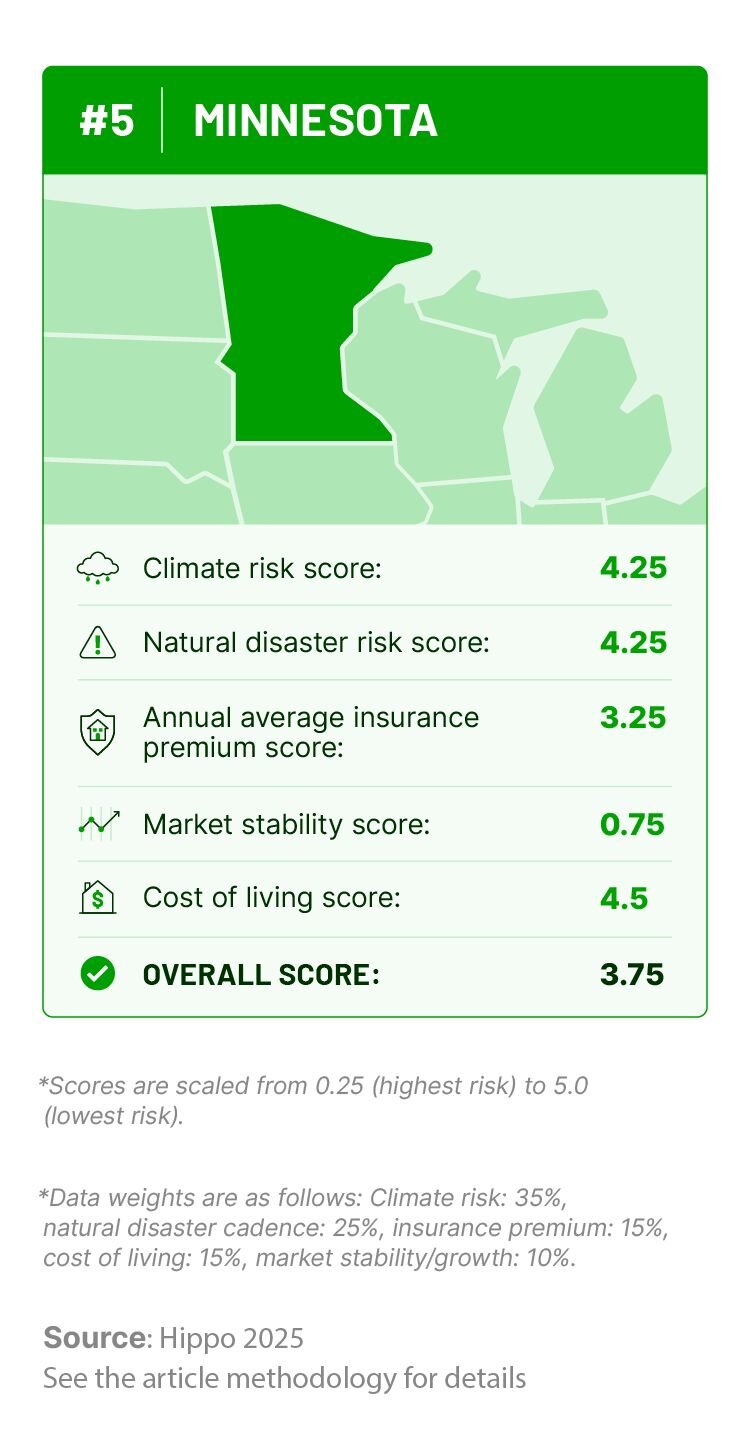
5. Minnesota: Freshwater access and cold-weather infrastructure 

As extreme heat, drought, and hurricanes strain coastal regions, Minnesota could serve as a refuge. Known as the Land of 10,000 Lakes, Minnesota’s abundance of freshwater sources offers a critical advantage as water scarcity intensifies elsewhere. 

The state also faces fewer climate-related disasters than much of the country. Our custom methodology found that Minnesota has one of the lowest climate risk scores and the fewest instances of natural disasters. 

And while severe winter storms still pose a risk to homeowners, the state is well-equipped to manage them with long-standing infrastructure and response systems. This readiness goes beyond prepping for harsh winters to prepare Minnesota’s communities, businesses, infrastructure, and natural environment with climate change resilience goals and adaptation.

That said, property taxes can be high in some counties, but housing in Minnesota remains relatively affordable compared to other climate-resilient areas. Homeowner insurance costs are also similar to the national average, with an average annual insurance premium of $2,4203.

With reliable public services and natural buffers against worsening climate threats, Minnesota stands out as a smart choice for homeowners considering long-term climate resilience. 
Graphic outlining Minnesota’s climate risk, natural disaster history, insurance costs, cost of living, and housing market stability scores.

The top 5 riskiest states to live in for climate change

While no state is completely risk-free, these five ranked lowest in our climate resilience scoring. In each case, high exposure to natural disasters, rising insurance premiums, or poor housing market trends placed them at the bottom of the list. Here’s a closer look at the key factors.

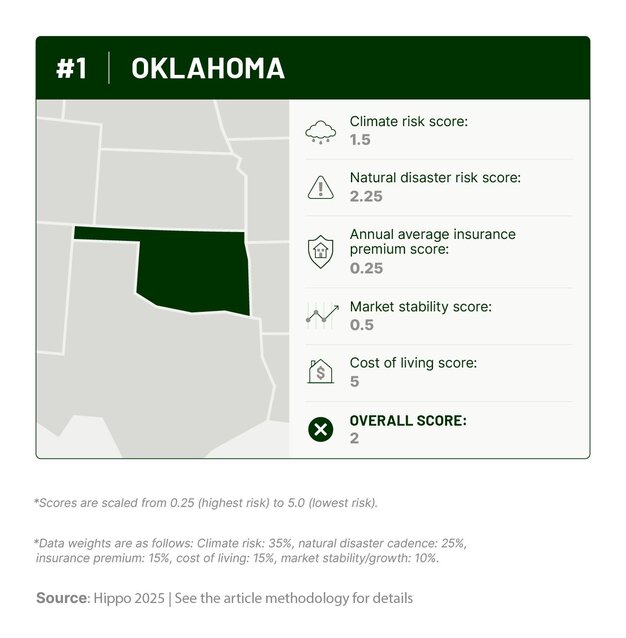
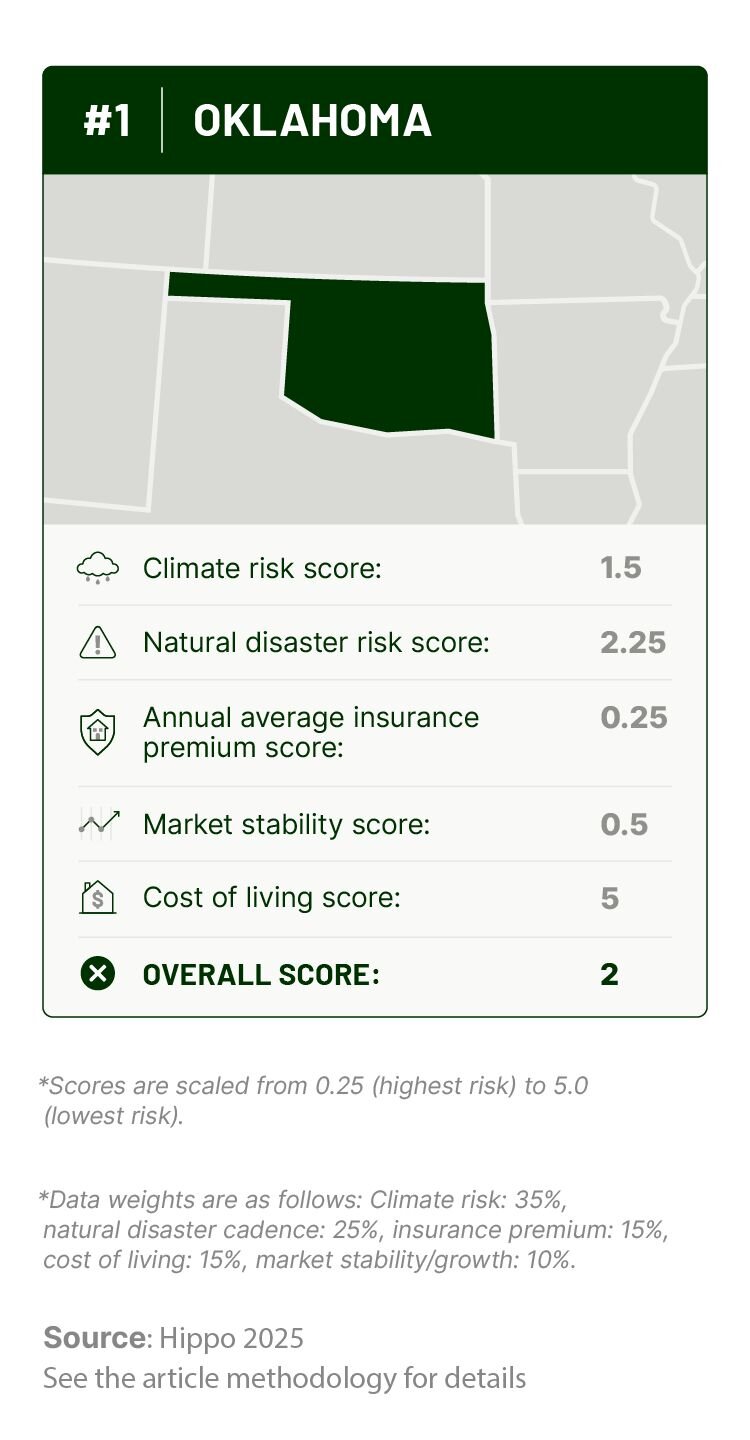
1. Oklahoma: Tornado risk and limited emergency infrastructure

Oklahoma ranks among the country's least climate-resilient states, largely due to its frequent exposure to severe weather and extreme temperatures. 

This state sits in the heart of “Tornado Alley,” and experiences high tornado volumes compared to other parts of the U.S. Residents also face high wildfire potential, persistent drought conditions, and intense temperature fluctuations.

According to the U.S. Climate Vulnerability Index2, Oklahoma is among the top 15 most climate-vulnerable states. This reflects environmental threats and social and infrastructure-related challenges that can hinder recovery. For example, 23 rural hospitals in Oklahoma are currently at risk of closing, putting some communities in an even more precarious position when disaster strikes.

These risks translate directly into higher costs for homeowners. In 2024, Oklahoma residents paid an average of $5,858 per year for home insurance, one of the highest rates in the nation, according to our analysis3.  

For homebuyers, this could mean navigating high upfront costs and elevated long-term risk. These factors combined place Oklahoma toward the bottom of our ranking for climate-conscious homeowners seeking long-term stability.
Graphic outlining Oklahoma’s climate risk, natural disaster history, insurance costs, cost of living, and housing market stability scores.

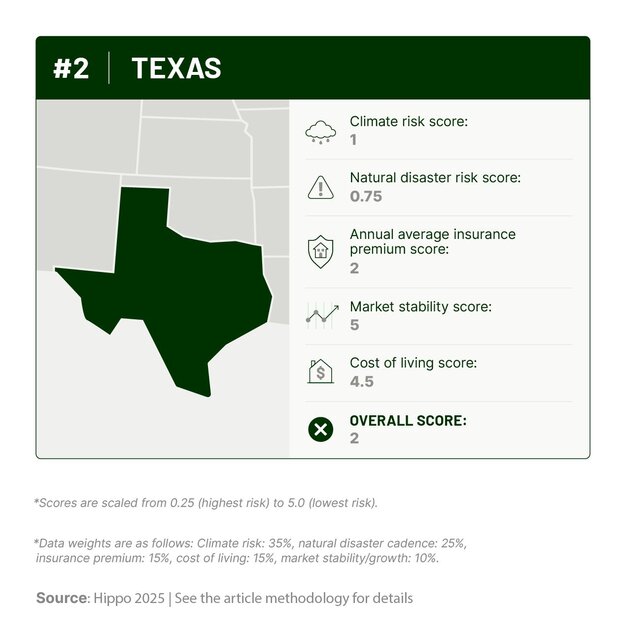
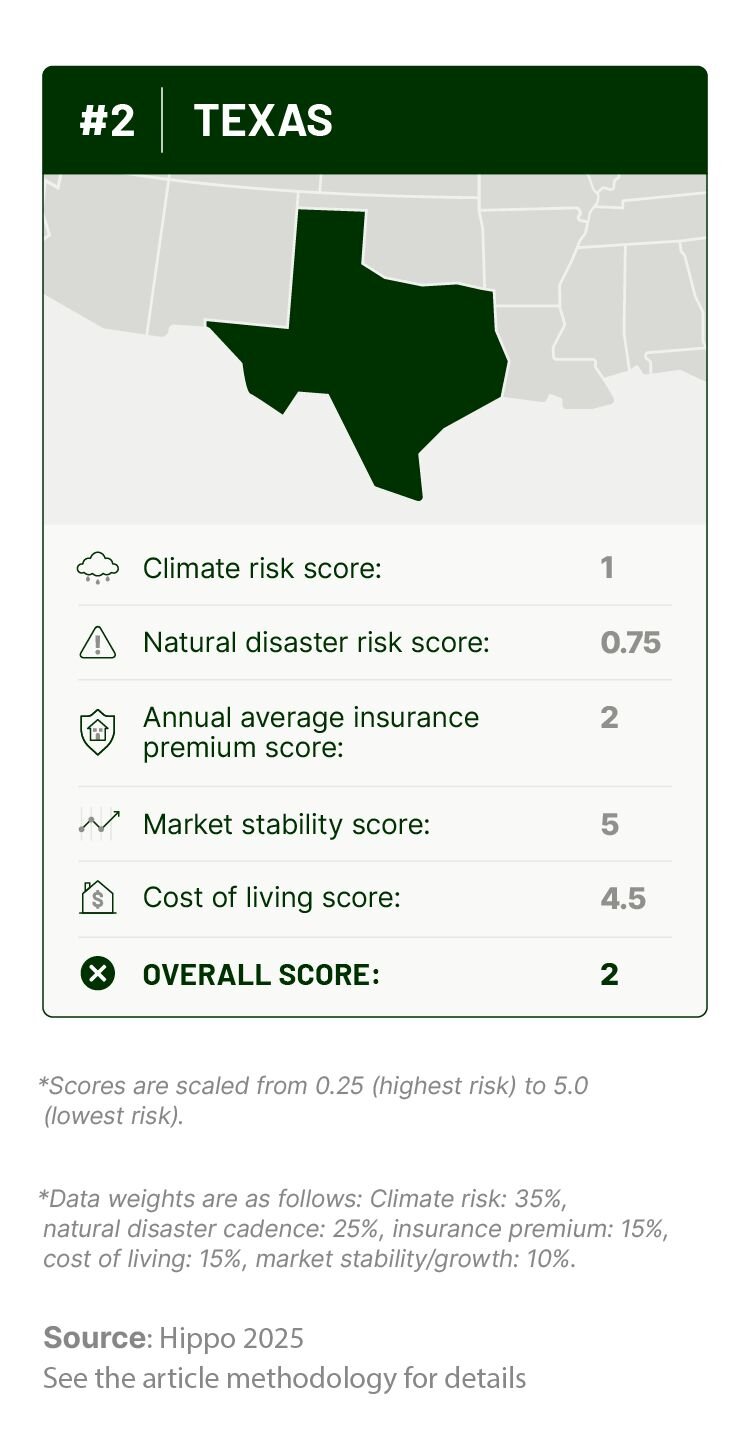
2. Texas: Sinking cities and rising insurance premiums

Texas continues to rank as one of the most climate-challenged states in the country. From Category 3 and 4 hurricanes along the Gulf Coast to widespread drought and record-setting heat waves, the state faces a broad spectrum of environmental risks. Power grid instability has also become a growing concern, particularly during extreme temperature events that strain energy infrastructure.

While Texas has seen incredible growth in residential housing, this climate volatility has driven up insurance premiums across Texas, with average rates nearing $3,851 per year3

Major cities like Houston and Dallas have also experienced repeated climate-related challenges. Recent reports show Houston is the fastest-sinking city in the U.S. due to water and oil extraction, with Dallas close behind. This highlights the growing risks of homeownership in regions where climate volatility is becoming the norm.
Graphic outlining Texas’s climate change risk, natural disaster history, insurance costs, cost of living, and housing market stability scores.

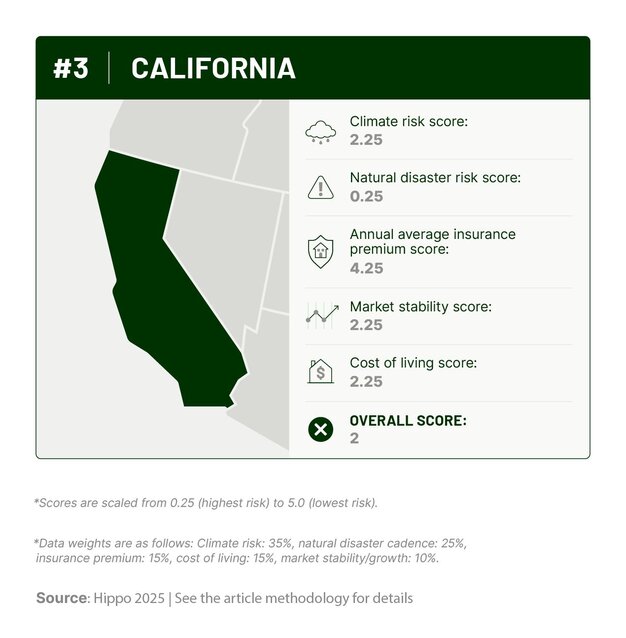
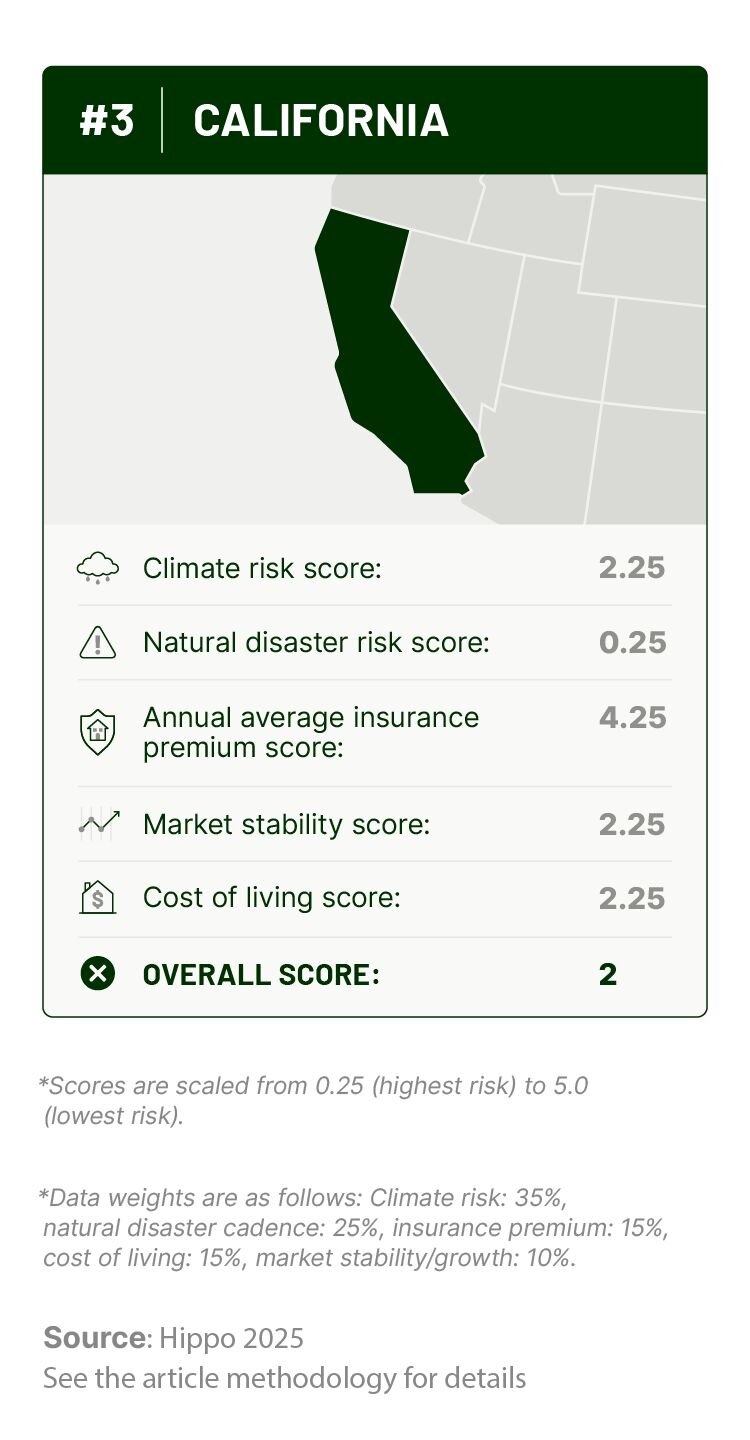
3. California: Wildfire zones pushing the limits of insurability

California’s climate change risk landscape is among the most complex in the country. Wildfires, drought, and water shortages create a year-round challenge for homeowners. Meanwhile, fire seasons have also lengthened in duration and intensity, fueled by dry vegetation, warming temperatures, and shifting wind patterns. 

Even densely populated areas like Los Angeles have faced fast-moving wildfires in recent years. The 2025 L.A. wildfires caused up to $53.8 billion in property damage, underscoring that wildfire risk isn’t limited to rural or forested regions. These risks have driven many insurers to scale back or exit the California market entirely, making homeowners insurance harder to find and more expensive. 

While the average premium in California is lower than in other states on our list, reaching $1,405 statewide3, there were significantly higher costs in areas with elevated fire risk. Take, for example, Paradise, where residents received annual premiums of around $10,000. Initiatives like the FAIR Plan have partially relieved this in recent years, but costs remain high. 

For homebuyers, especially those outside urban cores, navigating these risks adds another layer of complexity to what’s already one of the most expensive states to own a home.
Graphic outlining California’s climate risk, natural disaster history, insurance costs, cost of living, and housing market stability scores.

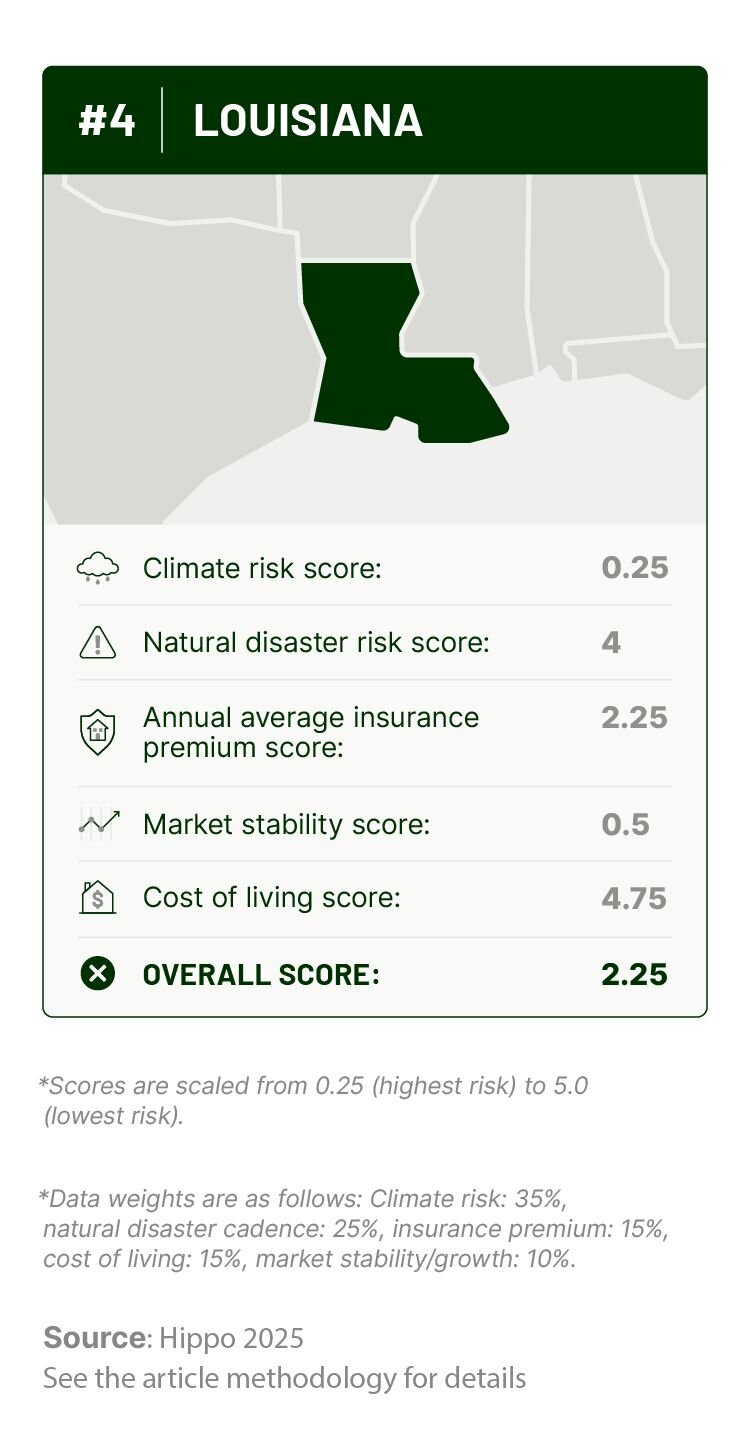
4. Louisiana: Rising seas and the high cost of recovery 

Hurricane risk dominates Louisiana's climate profile. With 79 federally declared disasters since 19531, the state has repeatedly borne the brunt of powerful storms. Cities like New Orleans and Lake Charles have faced catastrophic damage from hurricanes such as Katrina (2005) and Laura (2020).

Sea level rise and ongoing coastal erosion are making matters worse. Louisiana loses about a football field of land every 100 minutes, leaving low-lying areas even more exposed.

Louisiana insurance costs reflect the elevated risk. In 2024 alone, residents paid an average of $3,548 annually3. Many are also turning to state-backed plans like Louisiana Citizens, which can offer limited or more expensive policies in areas where private insurers have pulled back.
Graphic outlining Louisiana’s climate risk, natural disaster history, insurance costs, cost of living, and housing market stability scores.]

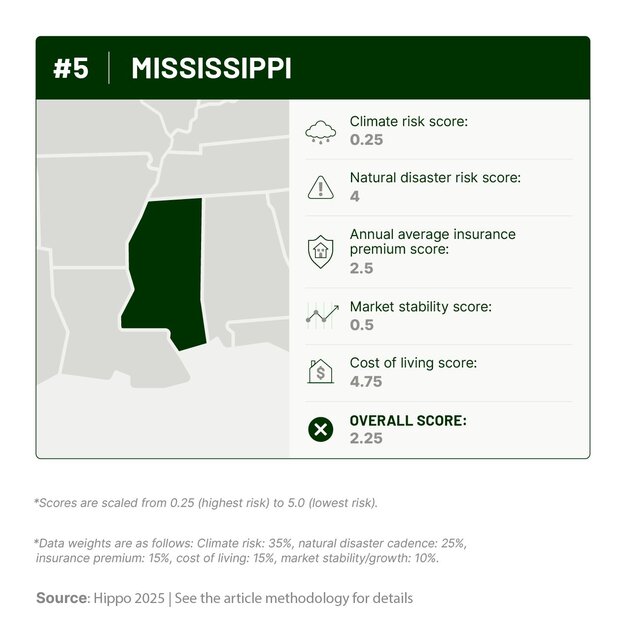
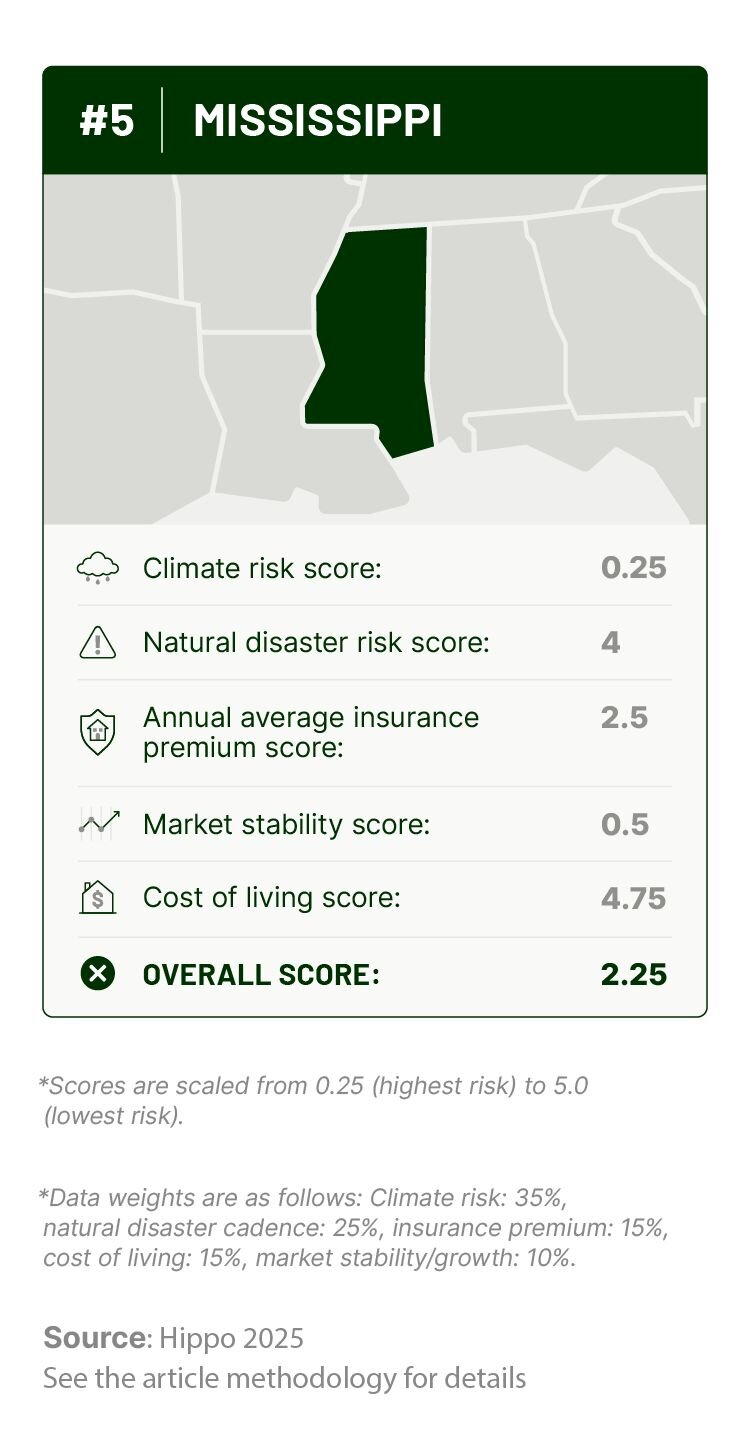
5. Mississippi: Flood-prone homes and economic hurdles 

Mississippi ranked lowest in our analysis due to the combined weight of climate vulnerability, economic instability, and limited market resilience. According to the U.S. Climate Vulnerability Index, it holds the worst overall score in the nation, driven by factors like flooding, heat stress, poor infrastructure, and low socioeconomic resilience.

While Mississippi is largely shielded from wildfires and earthquakes, it is increasingly susceptible to extreme heat, hurricanes, and inland flooding. These risks have already contributed to multiple federally declared disasters, and the state also faces serious challenges in housing quality, with older homes often less equipped to handle climate stressors.

Despite Mississippi’s cost of living being well below the national average, that advantage is counterbalanced by high insurance rates. In 2024, the average annual home insurance premium was $3,3803—a steep cost considering Mississippi’s median household income is one of the lowest in the nation.
Graphic outlining Mississippi’s climate risk, natural disaster history, insurance costs, cost of living, and housing market stability scores.
Relocating to one of the states least affected by climate change might seem like the best option for climate-conscious homeowners, but for many, it’s not financially realistic. 

Higher-risk states, like Mississippi, for example, present an affordability paradox. While the upfront cost of buying a home may be lower, the long-term exposure to risk and recovery expenses is high. That tradeoff leaves many homeowners locked into areas where climate-fueled threats (like flooding, wind and hail damage, wildfires, extreme heat waves, etc.) can put their homes and finances at risk. 

For those who can’t easily move, resilience becomes less about location and more about preparation. Fortunately, there are proactive steps homeowners can take to mitigate these climate-related risks and better protect their homes.

Home protection tips by emergency type: 
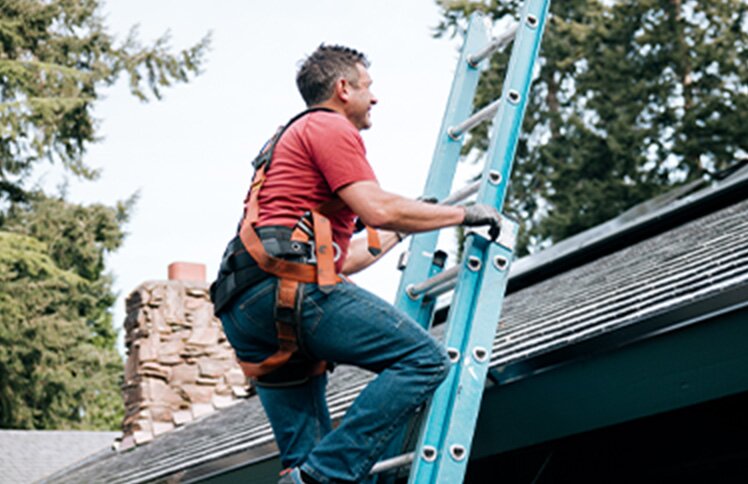
  • Consider installing hurricane shutters or reinforced windows to safeguard your home in areas prone to high winds (like those experiencing frequent tornadoes or hurricanes). These protective measures can help prevent damage from flying debris.
  • To help minimize damage in flood-prone areas, install flood barriers, a sump pump, or even raise your home's foundation. 
  • To help protect homes in wildfire-prone areas, consider fireproofing measures like installing double-pane windows with tempered glass, regularly cleaning gutters of dry leaves and debris, and pruning trees and shrubs to maintain a distance of at least five feet from the home.
  • To prepare for extreme cold or heat, ensure your home is well-insulated, and consider installing energy-efficient windows and HVAC systems. During seasons with extreme temperatures, have a backup heating or cooling plan in case of power outages.

Insurance coverage tips:
  • Make sure your policy covers climate-related events, such as wildfires, flooding, and hurricanes.
  • Understand policy exclusions, like flood damage, and consider additional coverage if needed.
  • Use Hippo’s Learn Center to stay informed about climate-related coverage options and how to protect your home.

Consider new builds and community safety measures: 
  • When buying a home, consider options built with disaster resilience. New construction homes often feature fire-resistant materials, elevated foundations, and better storm-proofing.
  • Engage with local governments to learn about climate resilience initiatives and emergency preparedness plans.
  • Stay informed about your community’s specific climate protocols and how they impact home safety and value.

Safeguard your home in a changing climate 

Climate risk is evolving. What may be a manageable threat today could worsen tomorrow. Ongoing vigilance and adaptation are essential to safeguarding your home for the long term.

At Hippo, we’re here to help. Download our free Hippo Home app for the tools and expert insights you need to help tackle home repairs and preventative maintenance. Our Learn Center also offers detailed articles and tools to help you understand the right insurance coverage for your needs. 

In the market for your next home? Download our checklist to help you identify homes with a lower climate risk.

Methodology: How we identified the best states for climate change

We set out to identify where homeowners can best avoid the growing impacts of climate change and extreme weather, without overlooking affordability. To do that, we developed a comprehensive ranking system based on five key factors. 

Each consideration reflects real-world concerns, from physical climate risks and overall cost of living to housing market stability and growth. 

  • 1Natural disaster cadence: We considered the number of federally declared natural disasters in each state since 1953, sourced from the World Population Review. A lower number of past disasters is considered more favorable.
  • 2Climate risk: We utilized the U.S. Climate Vulnerability Index, where scores range from 1 to 50, with a higher score indicating lower vulnerability to climate change impacts.
  • 3Average annual insurance premium: Data on each state's average annual homeowner's insurance premium was obtained from a 2023 to 2024 Insurance.com analysis. A lower premium is considered more favorable.
  • 4Housing market stability/growth: We analyzed the number of new privately-owned residential construction permits issued in 2024, based on U.S. Census Bureau data. A higher number of permits indicates greater market stability and growth, which we consider favorable.
  • 52024 annual average cost of living: To account for the overall affordability for homeowners, we incorporated the 2024 annual average Cost of Living Index for each state, sourced from the Missouri Economic Research and Information Center. A lower cost of living is considered more favorable.

Data normalization: 
Each of the five raw data points was normalized to a scale between 0 and 1. This process helps ensure that factors with different units and scales can be meaningfully compared. For factors where a higher raw value was better (climate risk and market stability/growth), the normalization preserved this logic. Conversely, for factors where a lower raw value was better (natural disaster cadence, insurance premium, and cost of living), the normalization was reversed so that a lower raw value resulted in a higher normalized score.

Data weighting: 
We assigned specific weights to each of the five factors to reflect their relative importance in our overall assessment. For each state, we multiplied its normalized score for each factor by its assigned weight:
  • Climate risk: 35% weight
  • Natural disaster cadence: 25% weight
  • Average annual insurance premium: 15% weight
  • Annual average cost of living: 15% weight
  • Housing market stability/growth: 10% weight

Overall score: 
We then summed the five weighted scores for each state to arrive at a final overall score. A higher overall score indicates a state that is more favorable for homeowners looking to avoid the impacts of climate change and extreme weather while also considering the cost of living, based on our chosen metrics and weights.

Ranking: 
Finally, we ranked the states based on their overall scores, with the highest score receiving the top rank and the lowest score receiving the bottom rank.
Graphic outlining Mississippi’s climate risk, natural disaster history, insurance costs, cost of living, and housing market stability scores.
Graphic outlining Louisiana’s climate risk, natural disaster history, insurance costs, cost of living, and housing market stability scores.
Graphic outlining California’s climate risk, natural disaster history, insurance costs, cost of living, and housing market stability scores.
Graphic outlining Texas’s climate change risk, natural disaster history, insurance costs, cost of living, and housing market stability scores.
Graphic outlining Oklahoma’s climate risk, natural disaster history, insurance costs, cost of living, and housing market stability scores.
Graphic outlining Minnesota’s climate risk, natural disaster history, insurance costs, cost of living, and housing market stability scores.
Graphic outlining Wisconsin’s climate risk, natural disaster history, insurance costs, cost of living, and housing market stability scores.
Graphic outlining Utah’s climate risk, natural disaster history, insurance costs, cost of living, and housing market stability scores.
Graphic outlining New Hampshire’s climate risk, natural disaster history, insurance costs, cost of living, and housing market stability scores.
Graphic outlining Vermont’s climate risk, natural disaster history, insurance costs, cost of living, and housing market stability scores.
Illustration of a U.S. map, highlighting the best and worst cities for climate change.

Share

Any Questions?
Ask away - we're here to help
Email us

Hippo

Social Media

Get the App

app QR codeScan me

© 2025 Hippo Holdings Inc.

References to “Hippo” mean Hippo Analytics Inc. d/b/a “Hippo Insurance Services” which is an insurance agency licensed in 50 states (California Lic. No. 0K96532, Texas Lic. No.2213178) that is domiciled in Delaware and has a principal place of business in California. Hippo sells property and casualty lines of insurance for affiliated and non-affiliated insurance carriers and other underwriting entities (“insurers”). Hippo receives compensation from insurers in the form of a base commission that is normally based on a predetermined percentage of the premium. You may contact Hippo for more information about compensation expected to be received by Hippo. Nothing on this site alters the terms or conditions of any insurance policy. Coverage and coverage amounts selected are the decision of the buyer. Availability and qualification for coverage, terms, rates, and discounts are subject to the insurer’s underwriting criteria, and may not be available in all states. Please read your policy for a complete description of coverage.