Key Homeowners Insurance Statistics for 2022

Let’s face it: home insurance is a complicated subject. Learning the ins and outs of what coverage you need versus what you actually have is enough to make even the most seasoned homeowner’s head spin. In fact, a recent study by J.D. Power found that not even half of consumers fully understand their current coverage, even though home insurance companies have been around for centuries.
That’s where we come in. In addition to shaking up the old boys’ club of the insurance industry with our modern, high-tech coverage, we also pride ourselves on keeping homeowners insurance simple. To aid in this effort, we created the following guide of the most important home insurance statistics, industry facts and homeowner trends you need to know to better understand home insurance.
Home insurance facts

While home insurance isn’t federally required, that doesn’t mean it isn’t a smart idea. Actually, many mortgage lenders require it, meaning you’ll likely have to get a policy if you’re taking out a loan to buy your home. And while HO-3 policies are the most common policies, many homeowners take things a step further, adding on insurance riders to make sure they are adequately protected.
Here’s a look at some interesting home insurance statistics and facts:
- The top three types of home insurance policies are HO-3 (79.9%), HO-5 (12.8%) and HO-2 (6.05%). [1]
- 27% of homeowners in the U.S. with home insurance policies said they have flood insurance coverage. [2]
- 32% of those in the Northeast
- 24% of those in the Midwest
- 30% of those in the South
- 20% of those in the West
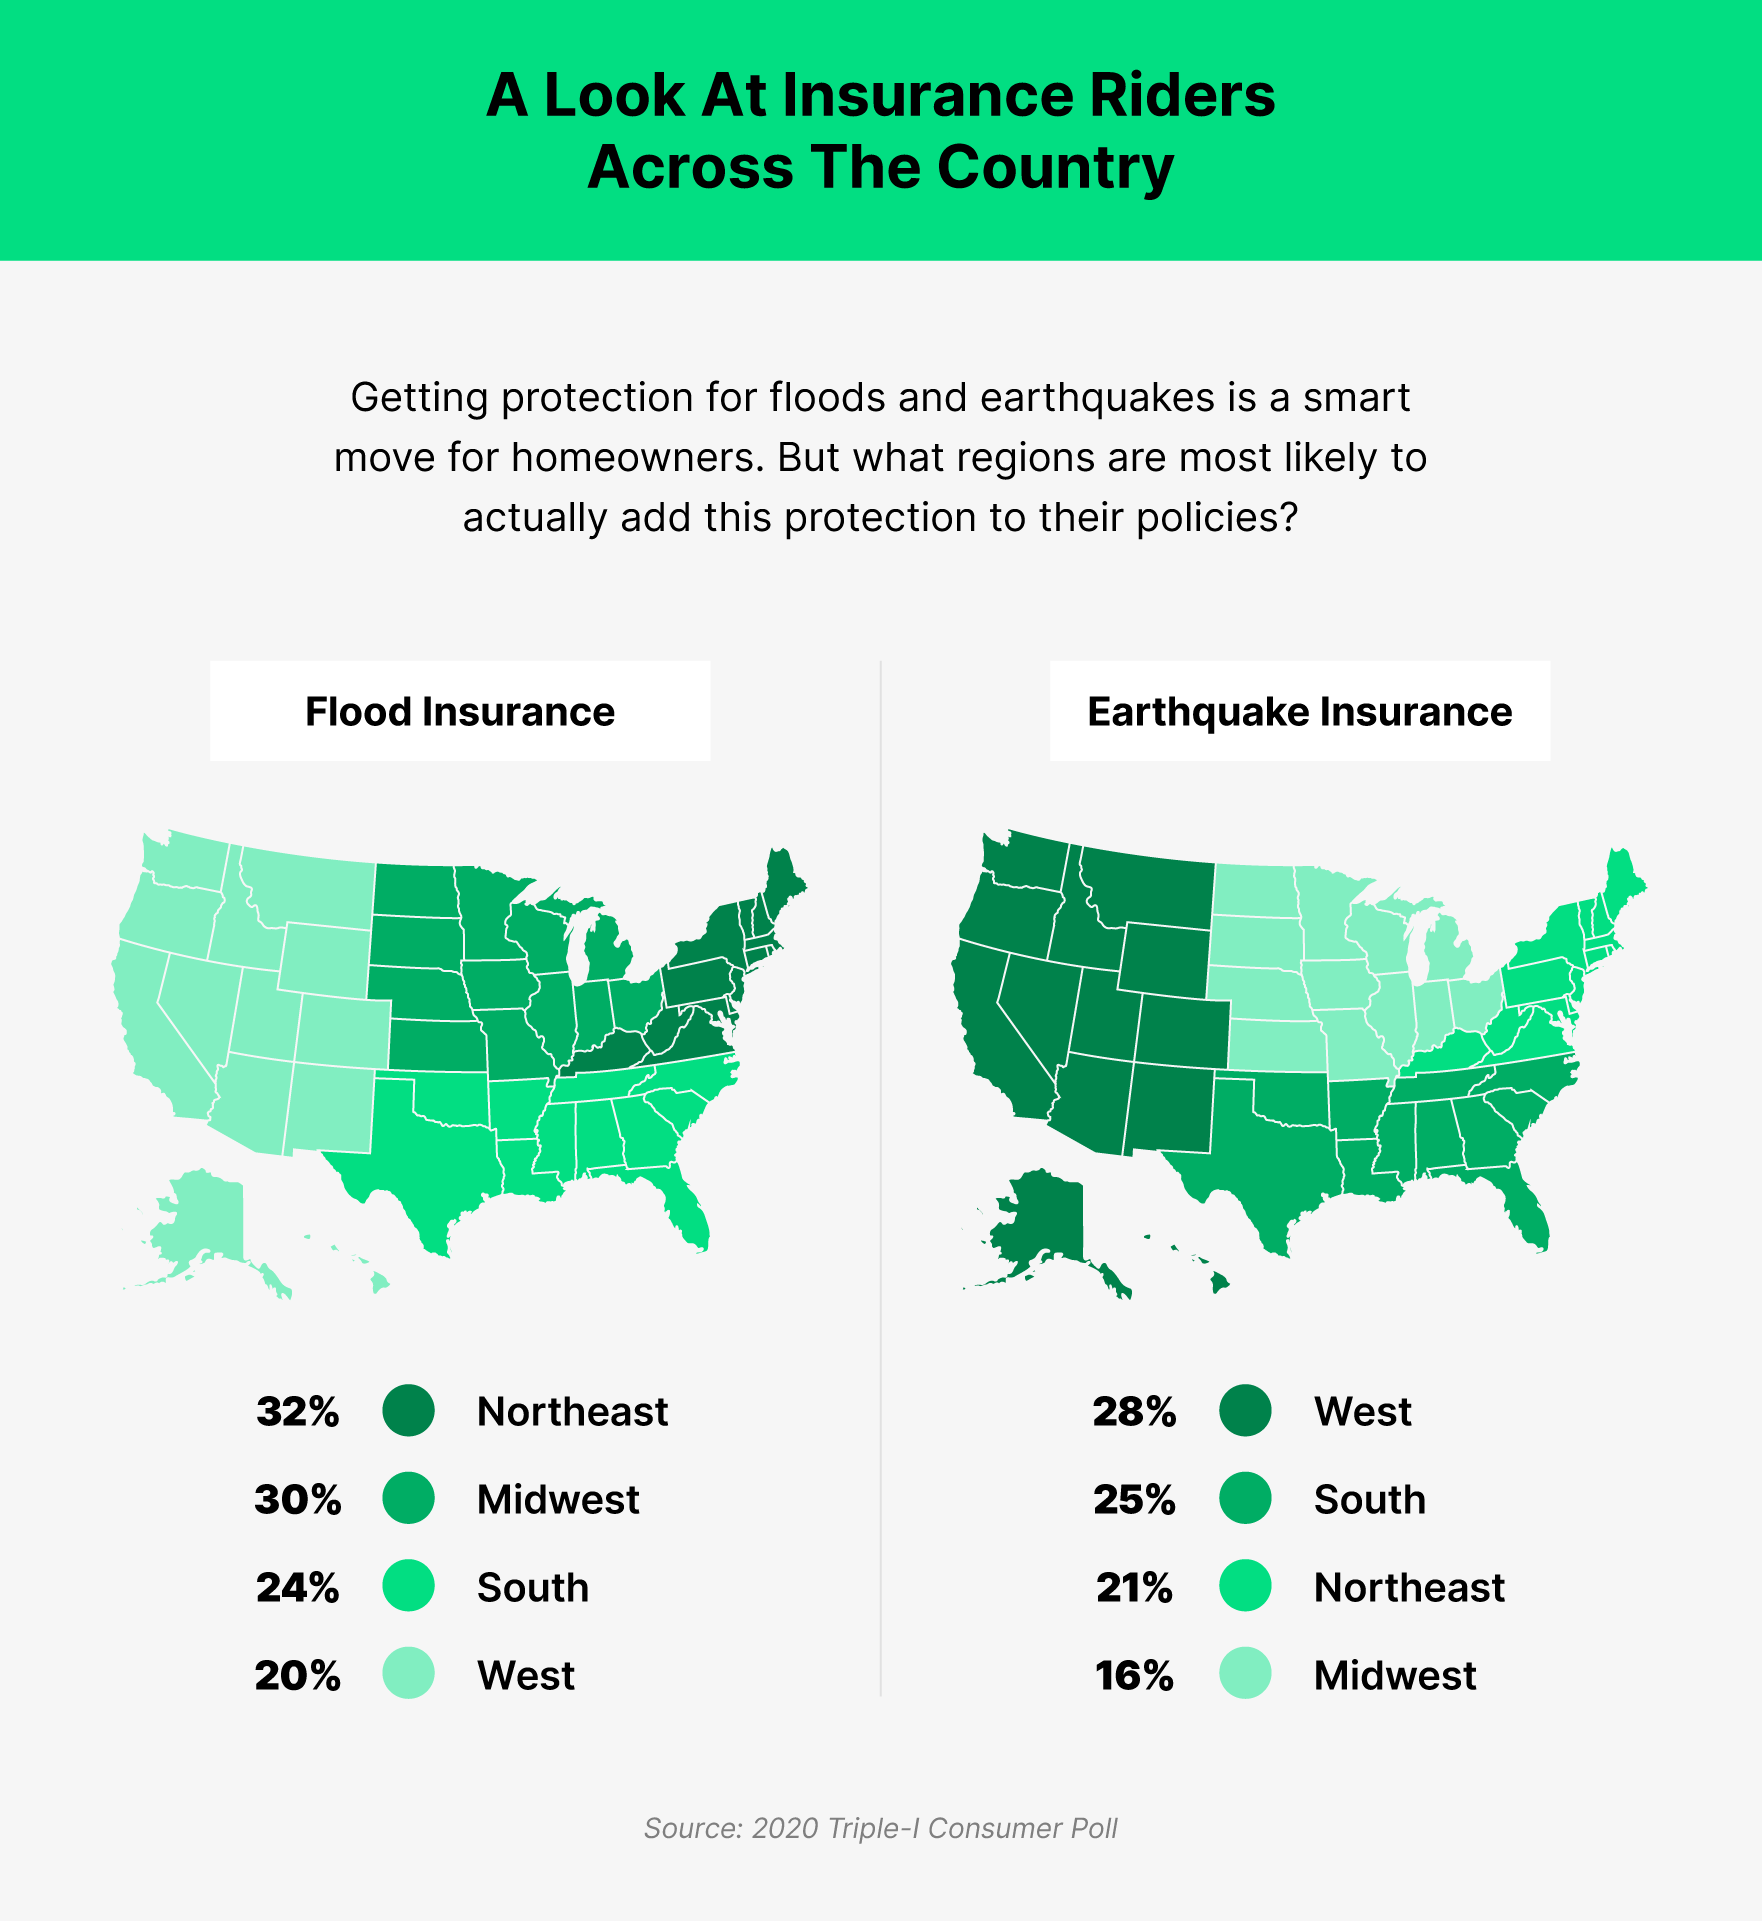
- Only 23% of homeowners in the U.S. said they have earthquake insurance coverage. [2]
- 21% of those in the Northeast
- 16% of those in the Midwest
- 25% of those in the South
- 28% of those in the West
- 95% of homeowners have home insurance, according to the Insurance Information Institute. [3]
- In 2019, Hawaii, California, New Jersey and Florida had the highest average homeownership costs. North Dakota, Indiana, Iowa and Kansas had the lowest. [4]
- In 2016, only 31% of Americans considered buying homeowners insurance to be a financial burden, the lowest percentage in over a decade. [5]
Stats about home insurance premiums
Home insurance premiums are rising across the board due to an influx of new homeowners as well as temperamental weather conditions across the country. Below, we highlight facts you should know about home insurance premiums.
Average Home Insurance Premiums
Click on the map below or check out the chart to view home insurance averages in each state throughout the country.
Alabama$1,611
Alaska$1,078
Arizona$927
Arkansas$1,543
California$1,133
Colorado$1,680
Connecticut$1,662
Delaware$936
Florida$2,193
Georgia$1,424
Hawaii$1,239
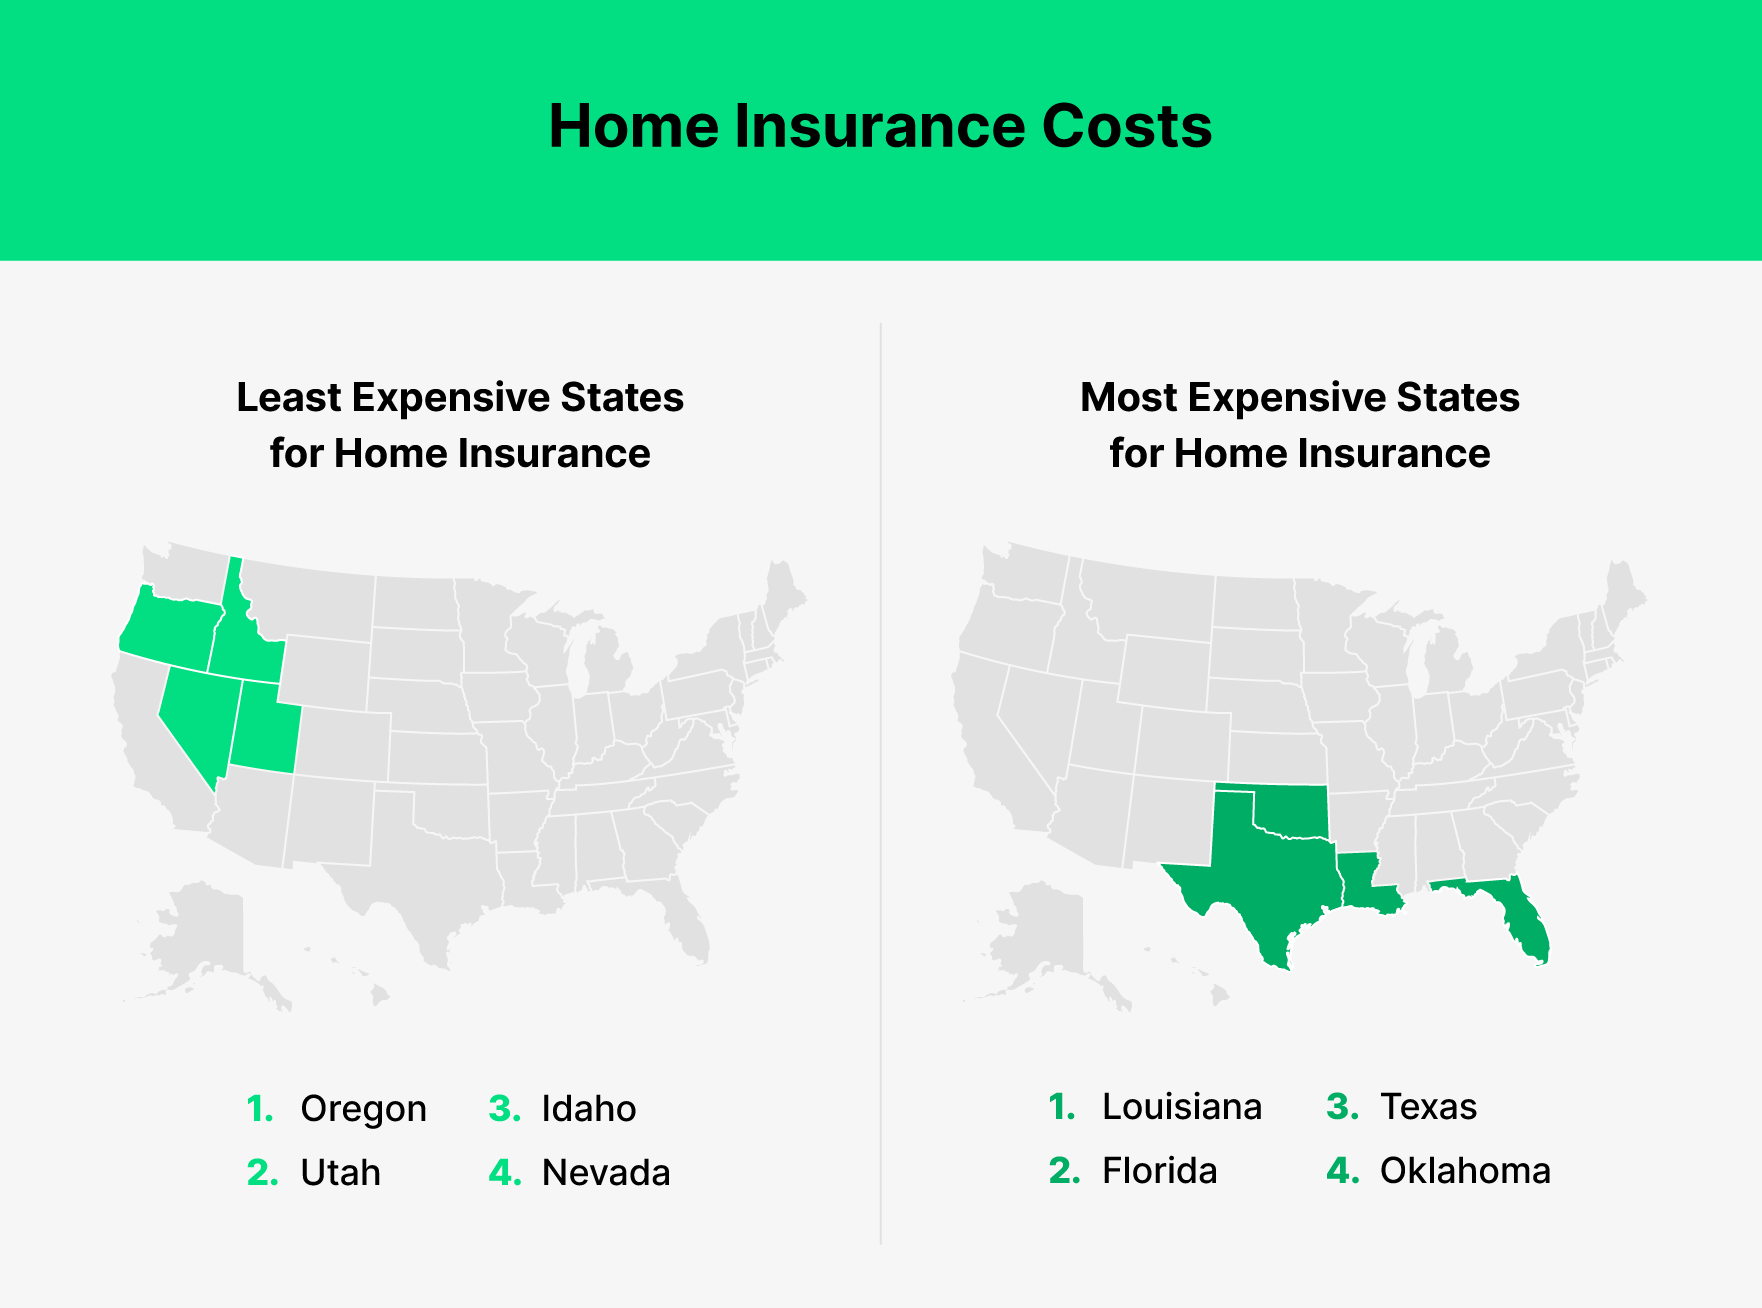
Idaho$820
Indiana$1,124
Iowa$1,083
Kansas$1,780
Kentucky$1,246
Louisiana$2,212
Maine$991
Massachusetts$1,672
Michigan$1,059
Minnesota$1,515
Mississippi$1,727
Missouri$1,444
Montana$1,319
Nebraska$1,664
Nevada$849
New Hampshire$1,092
New Jersey$1,340
New Mexico$1,143
New York$1,471
North Carolina$1,221
North Dakota$1,408
Ohio$969
Oklahoma$2,119
Oregon$761
Pennsylvania$1,046
Rhode Island$1,743
South Carolina$1,426
South Dakota$1,351
Tennessee$1,344
Texas$2,128
Utah$778
Vermont$1,032
Washington$960
West Virginia$1,056
Wisconsin$876
Wyoming$1,299

While no one wants their home to be damaged or their belongings to be stolen, things happen. When they do, you’ll have to file a claim with your insurance company to get financial help for repairs or replacements. Though certain claims are more likely to make your premiums rise than others, that doesn’t mean you should avoid filing a claim altogether. After all, that’s why you bought home insurance in the first place.
To learn more about the Hippo claim process, check out our article and the following statistics on home insurance claims.
- When surveying homeowners on the coverage they’ll have when submitting a claim … [2]
- 55% said their insurer would pay the replacement cost
- 25% said their insurer would pay actual cash value
- 20% mistakenly think their insurer will pay out market value
- Wind caused the most property damage in the United States from 2009 to 2016, at 24%. Other common damaging events include water (non-weather-related) (20%) and hail (16%). [8]
- The most expensive weather events from 2009 to 2016 were fire (25%) and hail (20%). [8]
- The average home insurance claim payment is $442. [9]
- The states with the highest average claim payments are Oklahoma, Mississippi and Nebraska. [9]
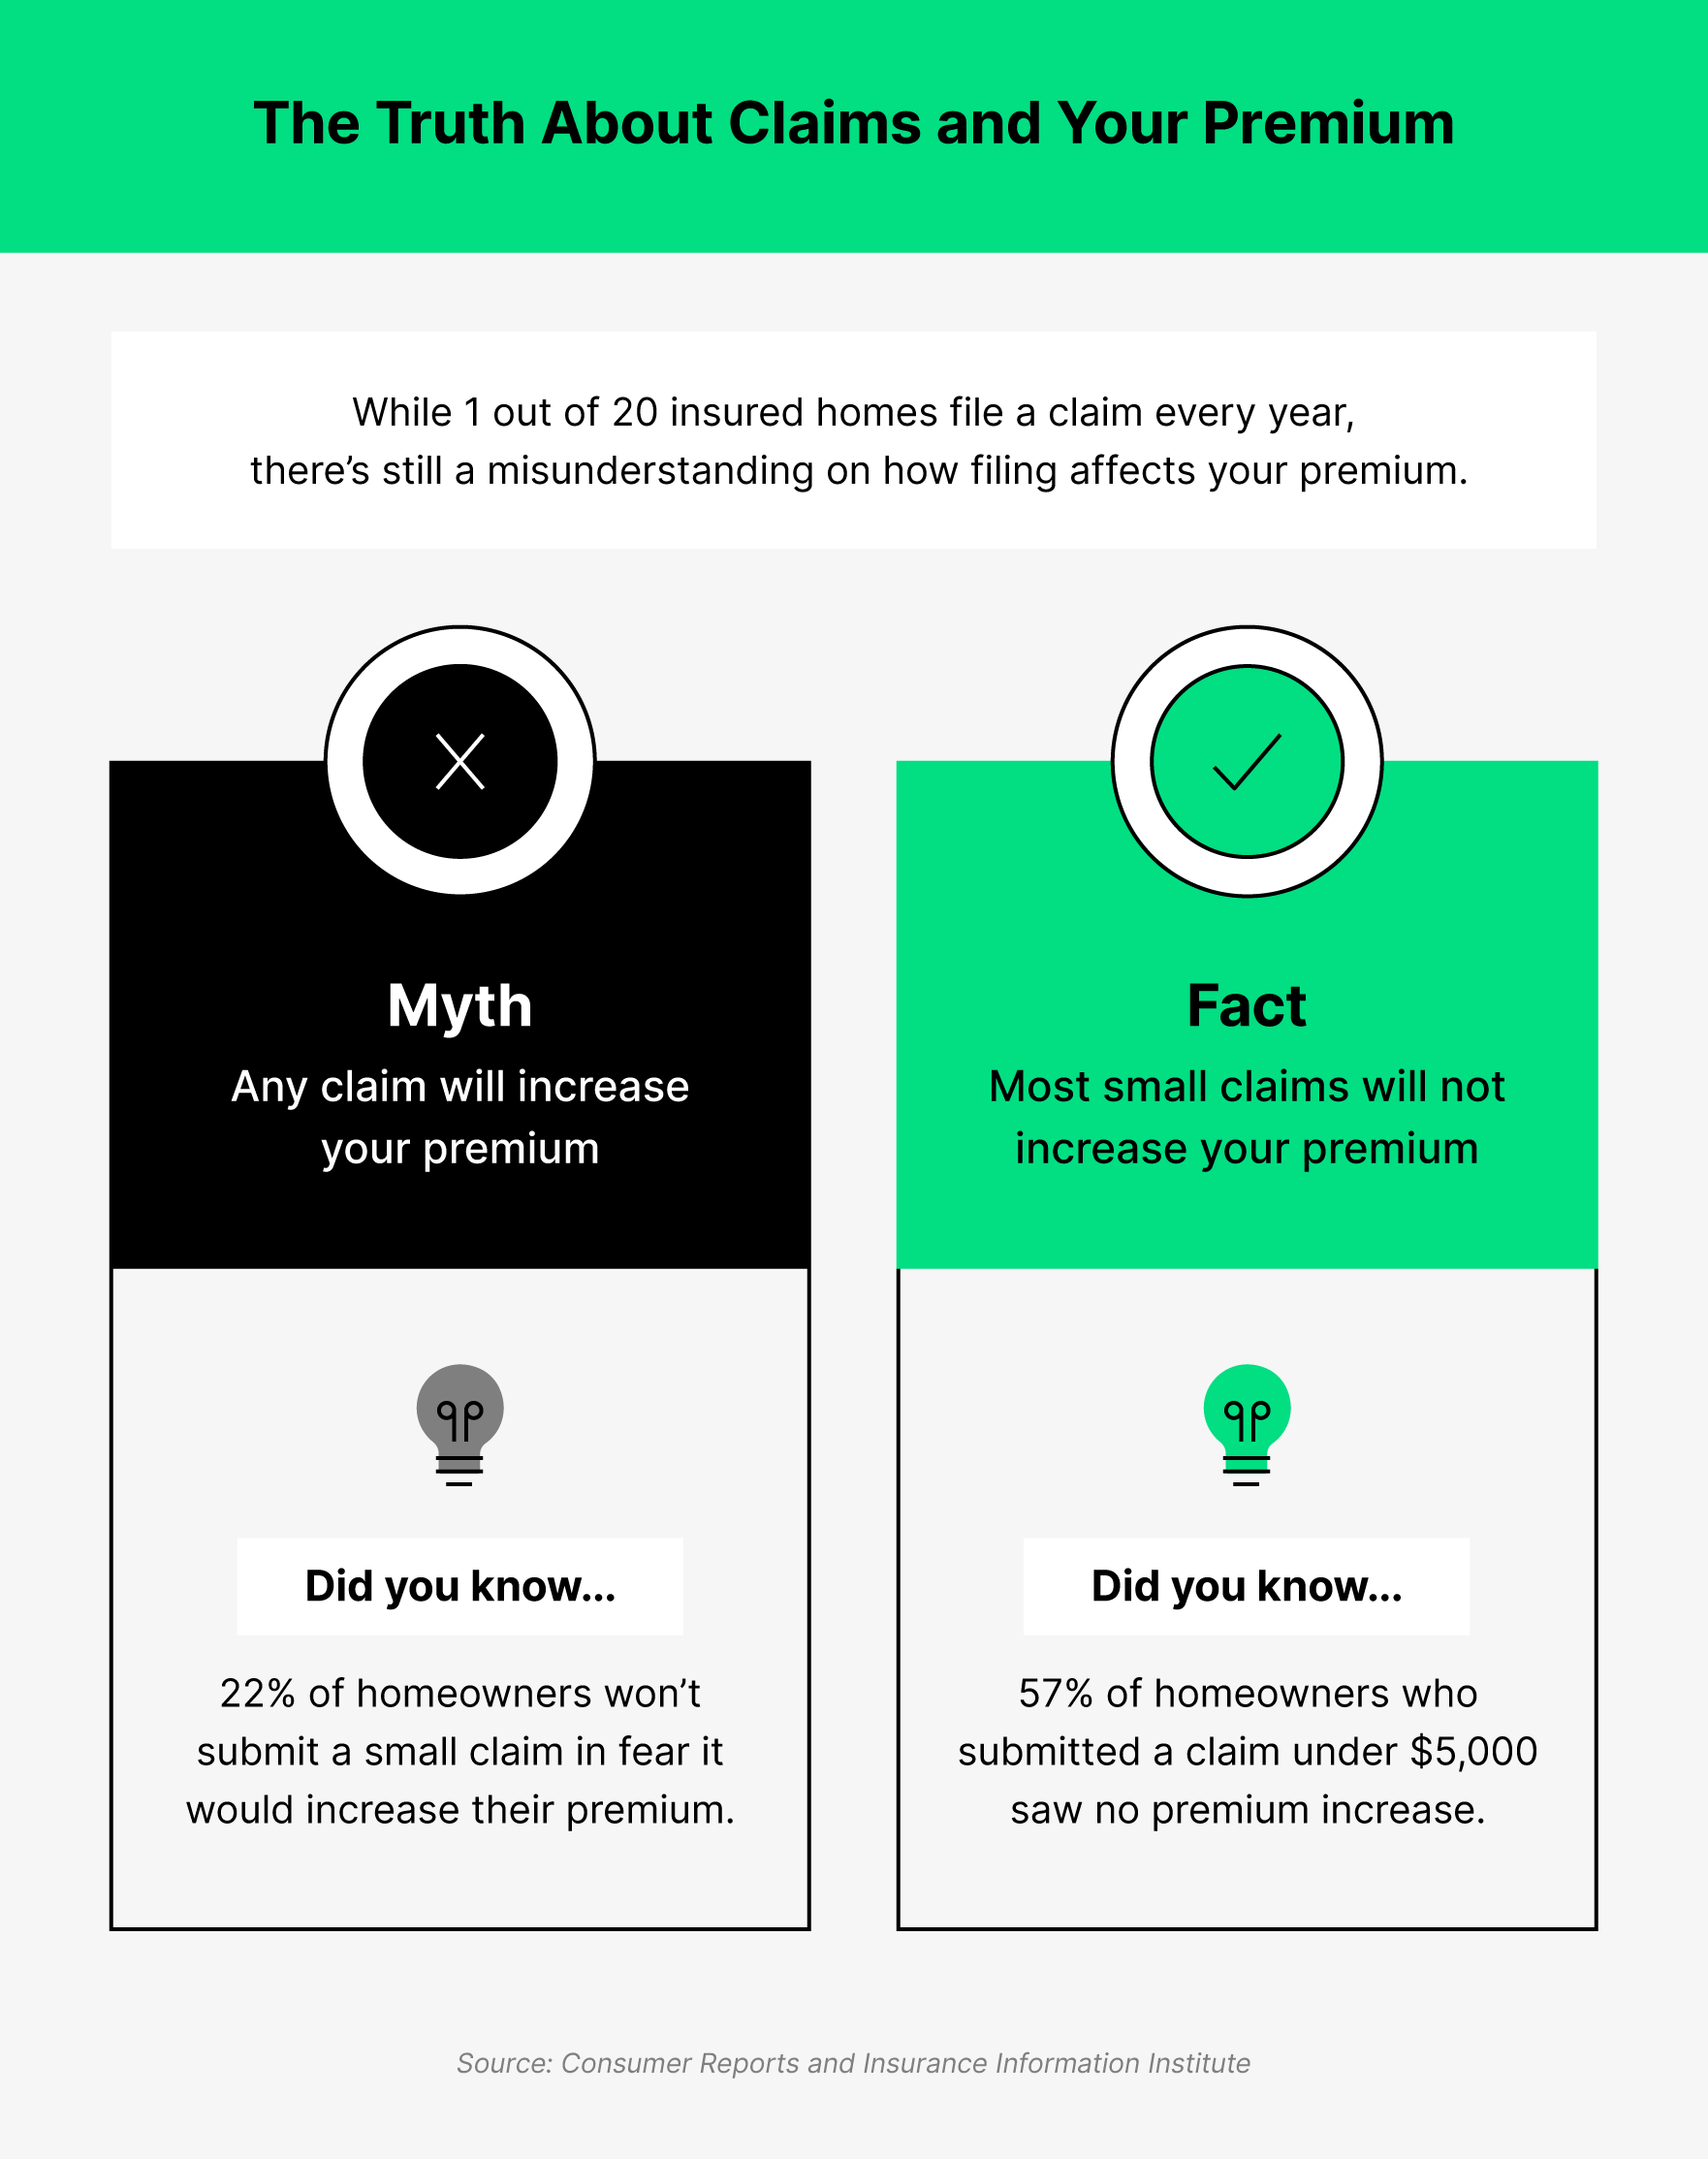
- One out of every 20 insured homes submit a claim each year. [4]
- 22% of consumers said they wouldn’t claim a small loss in fear it would make their premiums rise. [10]
- But 57% of consumers who submitted a claim for less than $5,000 saw no premium price hike.
Leading causes of home insurance losses
Wind, hail, fire, theft, water...many things can cause damage to your home or belongings. But what exactly causes the most loss, and how have these numbers changed over time? We’re glad you asked.
- Since 2014, liability claims have accounted for an average of 3.7% of losses incurred each year. [4]
- 90% of the catastrophe losses in 2019 resulted from hail and wind perils. [11]
- Fire and lightning loss costs decreased by 37% from 2018 to 2019. [11]
- Overall peril loss was 13% less in 2019 than in 2018. [11]
- In 2019, theft accounted for 1% of total home insurance losses, a 47% decrease from 2016. [4]
Home insurance industry statistics

The home insurance industry is nothing new. Legacy brands have been operating for quite some time, but little has changed about the protection they offer. That’s where modern and tech-savvy brands like us come in, offering a new approach to home insurance that includes plenty of smart home devices. Read on to learn more about the top industry statistics, or check out our post on smart home statistics to get the inside scoop on smart homes.
- Home insurance customer satisfaction scores reached a record high of 808 (on a 1,000-point scale) in 2017. [12]
- The two lowest-performing satisfaction factors were price and customer service interactions.
- Only 5% of all consumers who own property are aware of insurtech insurance companies. [12]
- Millennials are the most likely demographic (at 11%) to be aware of insurtech companies. [12]
- 29% say they definitely/probably will purchase from one in the future.
- The top three home insurance companies based on customer satisfaction scores are Amica Mutual, Shelter and COUNTRY Financial. [12]
- The most important things in home insurance carriers, according to consumers, are price, quality of service and coverage options. [13]
- There are over 2,490 property/casualty companies operating in the U.S. as of 2019. [7]
- It’s estimated that by June 2020, U.S. insurers donated over $280 million to aid in the global pandemic. [14]
- Across the globe, start-up insurtech insurance companies have raised more than $7.1 billion. [12]
Homeowners and their policies

If you’re a little foggy about what your home insurance policy actually covers, you aren’t alone. Consumers are buying up homes left and right but doing little research when it comes to buying a policy. Read on to see how consumers stack up when guessing what protection they already have and the biggest homeowner trends for 2021.
- Home prices increased 13% from April 2020 to April 2021, the fastest year-over-year increase since February 2006. [15]
- While over 69% of U.S. households have at least one smart device [16], only 15% said they use those devices to get their utility costs lowered. [17]
- 25% of homeowners would make changes to their home to protect themselves from hurricanes if it meant they received grant money. [2]
- In 2020, 43% of homeowners said they had a home inventory — either a written list, video or pictures — to show their insurance provider in the event of belonging damage. [2]
- 52% of homeowners said they’d rather have a provider with a great user experience than a high financial rating. [13]
- Less than half of homeowners (44%) admitted to comparison shopping when renewing their home insurance policies. [5]
- Those who do comparison shop do so via:
- In-person meetings (29%)
- Phone (24%)
- Online (17%)
- Those who do comparison shop do so via:
- When asked why they have a home insurance policy, over 75% of homeowners stated it was because they wanted to protect their investment. Other reasons included: [13]
- For peace of mind (69%)
- Because their lender requires it (52%)
- For personal liability protection (35%)
Homeowner misconceptions
Though many homeowners quickly get up to speed on how to mow their lawn or fix a toilet properly, there are still a lot of misconceptions when it comes to their home insurance policy. From thinking they have specific coverage built into their policy — to being overconfident that they are getting the best deal — here’s what we uncovered about homeowners and their insurance policies.
- Only 48% of customers say they completely understand their policy. [12]
- Baby boomers are the most likely generation to feel confident that they know what their policy covers, at 32%. [13]
- 43% of homeowners mistakenly believe that they have coverage from flooding under their standard home insurance policy. [5]
- 29% of homeowners incorrectly believe that standard homeowners insurance covers earthquake damage. [5]
- 27% of homeowners don’t think their policy includes loss of use coverage, which it typically does. [5]
While diving deep into the numbers can help you better understand what questions to ask, the best way to ensure you have the homeowners insurance coverage you need is to work directly with an insurance agent. They’ll walk you through every step of the process, using their expertise to give you a policy that fits your lifestyle. If you’re interested in making a switch, or you’re looking to protect your very first home, just give us a call. Our insurance agents are standing by.