State of Suburbia: Where Suburban Development is Surging
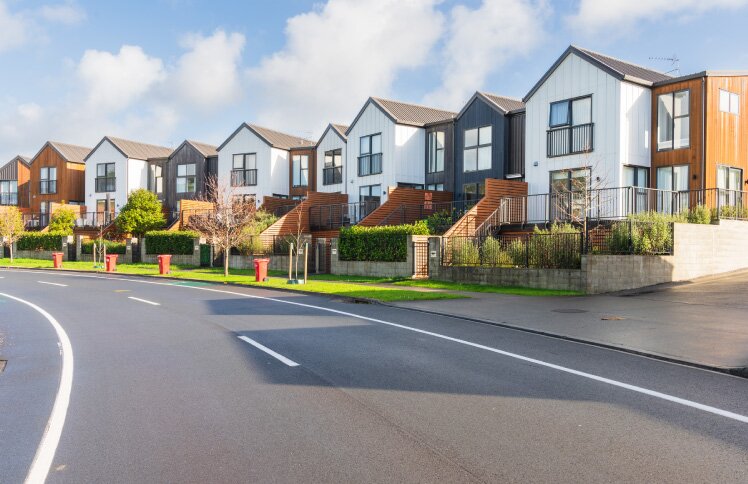
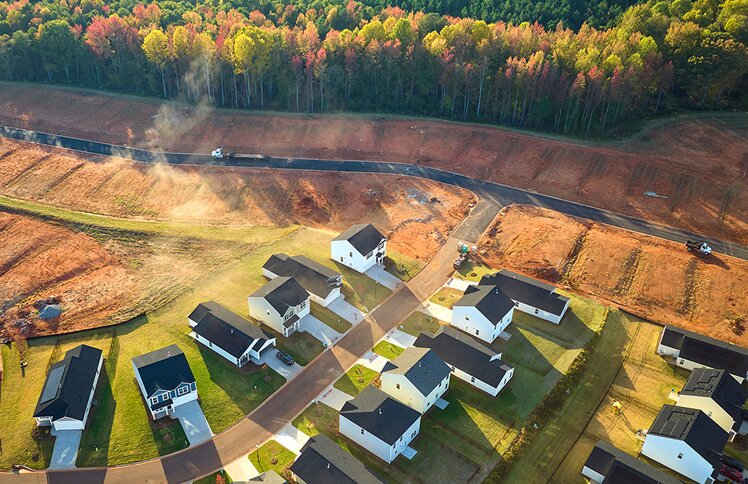
America’s suburbs are evolving—and fast. As more buyers look beyond major cities for space, value, and community, high-growth suburban neighborhoods are becoming hotspots for new development. For builders, this presents an opportunity to meet this booming demand with thoughtfully planned communities that reflect where, and how, people want to live.
Discover the suburbs seeing the fastest growth across the U.S., what’s driving their momentum, and how builders can strategically position themselves in these expanding markets.
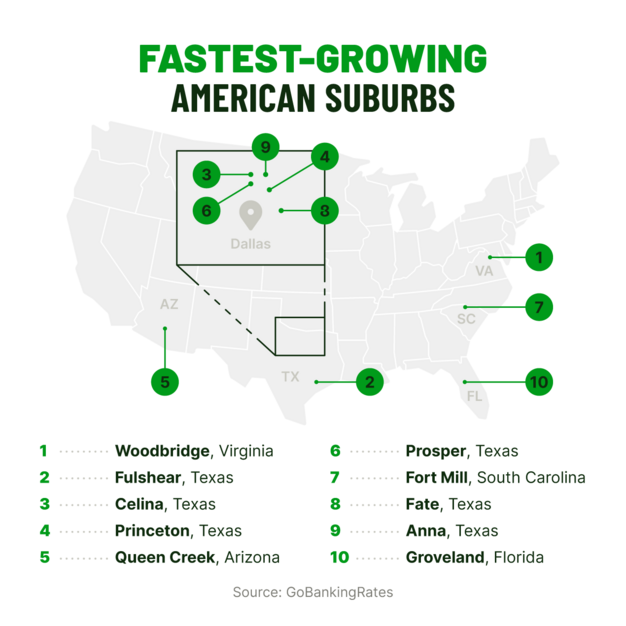
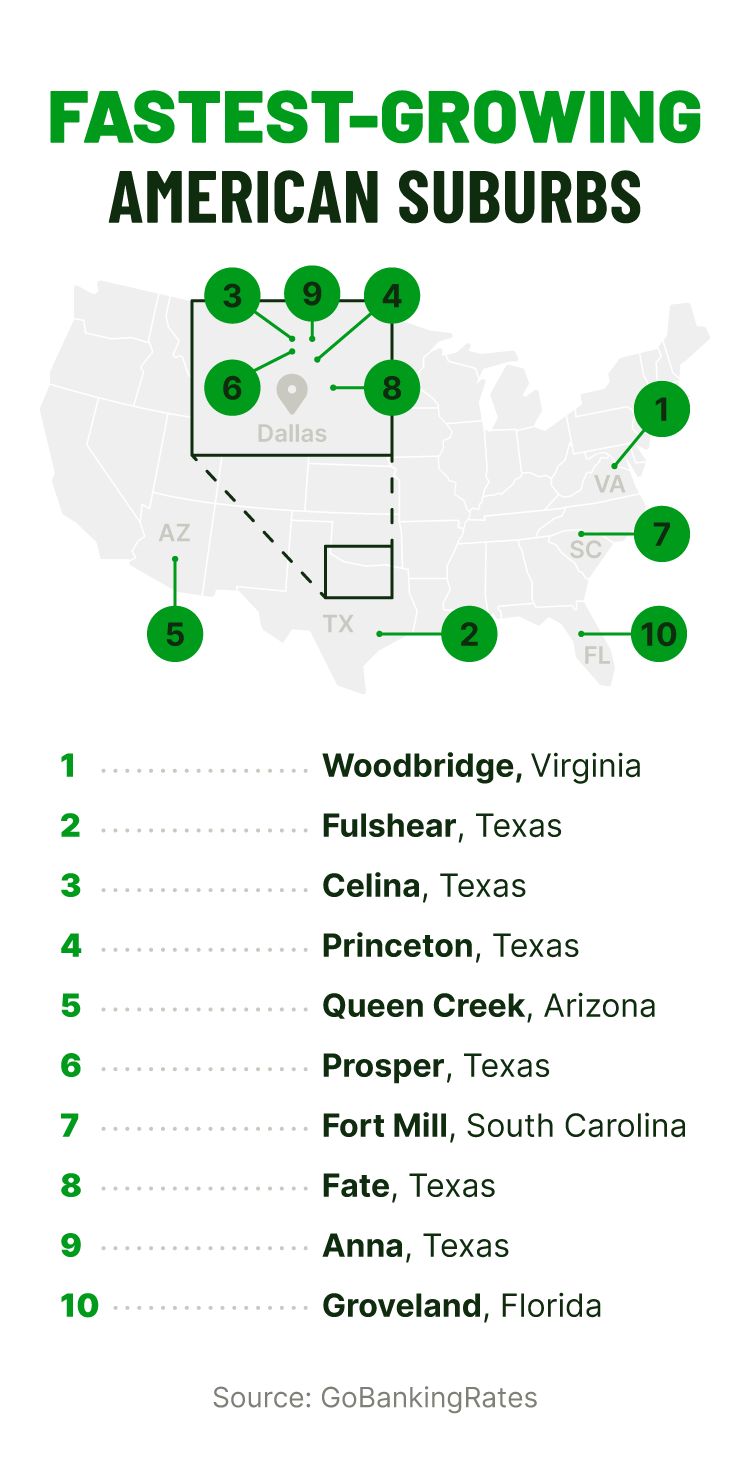
Top 10 fastest-growing suburbs in the U.S.
SUBURB NAME & LOCATION | POPULATION SIZE | POPULATION GROWTH |
|---|---|---|
1. Woodbridge, Virginia | 43,443 | 887% |
2. Fulshear, Texas | 26,986 | 237% |
3. Celina, Texas | 27,141 | 190% |
4. Princeton, Texas | 20,966 | 115% |
5. Queen Creek, Arizona | 66,369 | 84% |
6. Prosper, Texas Row 2, Cell 1 | 34,567 | 81% |
7. Fort Mill, South Carolina | 28,281 | 78% |
8. Fate, Texas | 20,757 | 77% |
9. Anna, Texas | 20,975 | 71% |
10. Groveland, Florida | 20,621 | 65% |
It's important to acknowledge that some of this growth can be attributed to the U.S. Census Bureau's redefinition of certain Census Designated Places. Even so, this data highlights rapid population growth in suburban areas across the United States, with Texas and the broader Sunbelt region showing particularly strong expansion.
Buyers also show a strong preference for smaller cities and suburbs within these states, a trend reflected in the fact that many of the fastest-growing areas have populations under 50,000. For homebuilders, these emerging markets offer a strategic opportunity to grow in areas with less saturation and strong long-term potential.
That said, as we continue digging into these suburban trends, the question isn’t just where growth is happening, but why.
Where (and why) suburban areas are surging
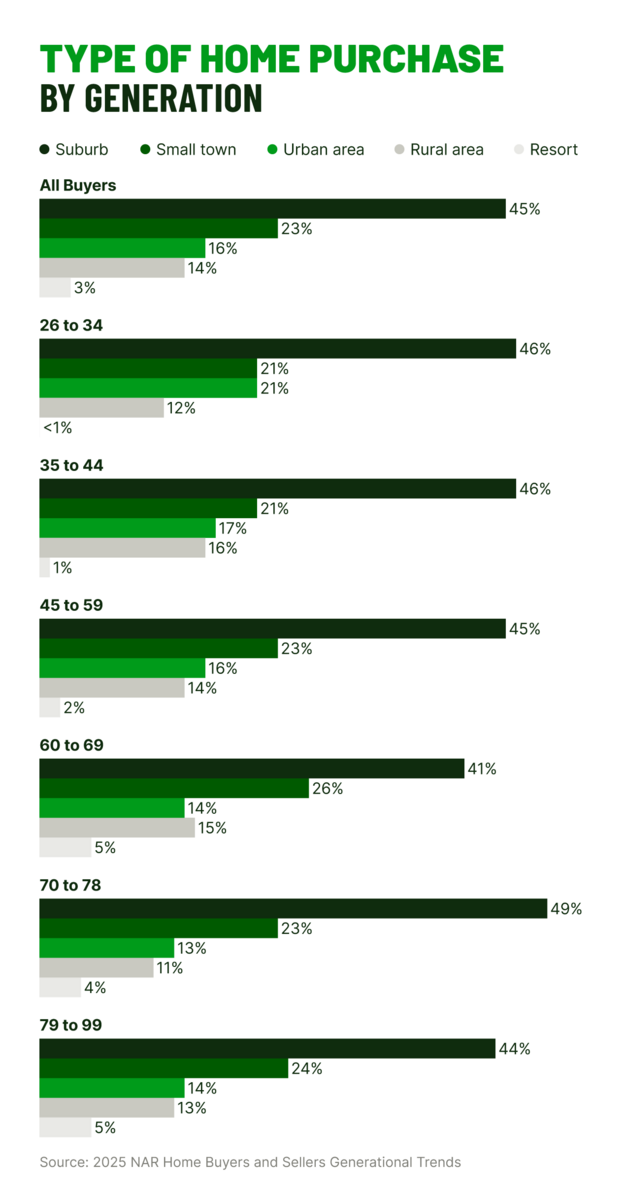
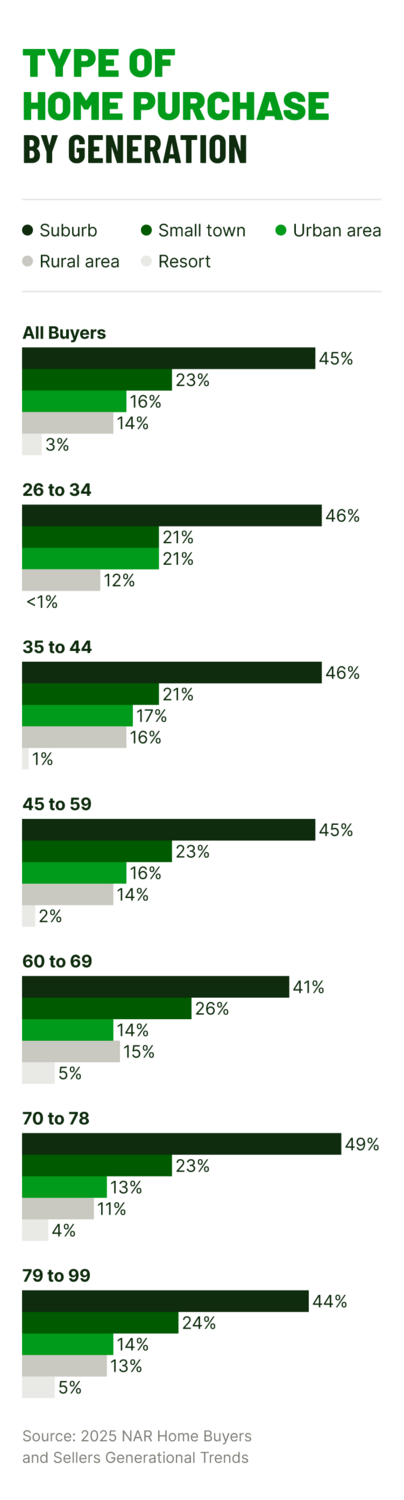
According to the National Association of Realtors (NAR), southern states (particularly Texas, Florida, and the Carolinas) continue to lead the nation in domestic migration. And, despite a tendency for movers to choose familiar surroundings, a notable suburban migration boom is underway.
Suburban areas were the top destination for movers from both central urban areas and resort towns. Among recent buyers, 41% leaving urban centers and 44% leaving resort communities most often chose the suburbs. This shift highlights a growing demand for more homes that offer access to communities where residents can enjoy more space, freedom, and control over how they live.
Demographics driving suburban growth
Historically known for their more homogeneous populations, today’s suburbs are evolving into more modern and diverse communities. A 2023 study from the Russell Sage Foundation Journal of the Social Sciences supports this, finding that suburban populations have become increasingly diverse over the decades.
This housing trend could reflect both the lower cost of suburban homes compared to urban residences and a broader shift away from American city centers, with nearly two-thirds of all metro residents now living in the suburbs.
To attract this increasingly diverse population of potential homebuyers, suburban planning could focus on creating inclusive communities that reflect cultural diversity and provide a variety of accessible services.
This includes characteristics such as:
- Flexible floor plans that can support different family structures
- Public spaces that foster community connection
- Walkable infrastructure and access to public transit
- Retail and service offerings that reflect the community’s makeup
- Communications and signage that support a multilingual population
FACTORS | YOUNGER MILLENNIAL: 26–34 YEARS | OLDER MILLENNIAL: 35–44 YEARS | GEN XER: 45–59 YEARS | YOUNGER BOOMER: 60–69 YEARS | OLDER BOOMER: 70–78 YEARS |
|---|---|---|---|---|---|
Quality of the neighborhood | 61% | 65% | 60% | 58% | 53% |
Convenient to friends/family | 53% | 43% | 36% | 47% | 54% |
Overall affordability of homes | 51% | 41% | 34% | 33% | 29% |
Convenient access to work | 64% | 55% | 43% | 19% | 5% |
Convenient access to shopping | 22% | 25% | 27% | 34% | 36% |
Building better-protected suburbs
Related articles
Future of American Suburbs: Redefining Where (and How) We Live
Master-Planned Communities: Perks, Costs, and Insurance Coverage
Confronting Home Repair Scams: Experts Weigh In on How To Protect Yourself

When Is the Best Time To Buy a House? Expert Tips for Homebuyers

94% of New Construction Homeowners Are Willing to Pay More for Flex Spaces